Underground Natural Gas Working Storage Capacity
Natural gas storage design capacity and demonstrated peak capacity decreased in 2021
We assessed that underground working natural gas storage capacity in the Lower 48 states declined in 2021 compared with 2020, by about 1%. We use two metrics to assess working natural gas storage capacity: design capacity and demonstrated peak capacity.
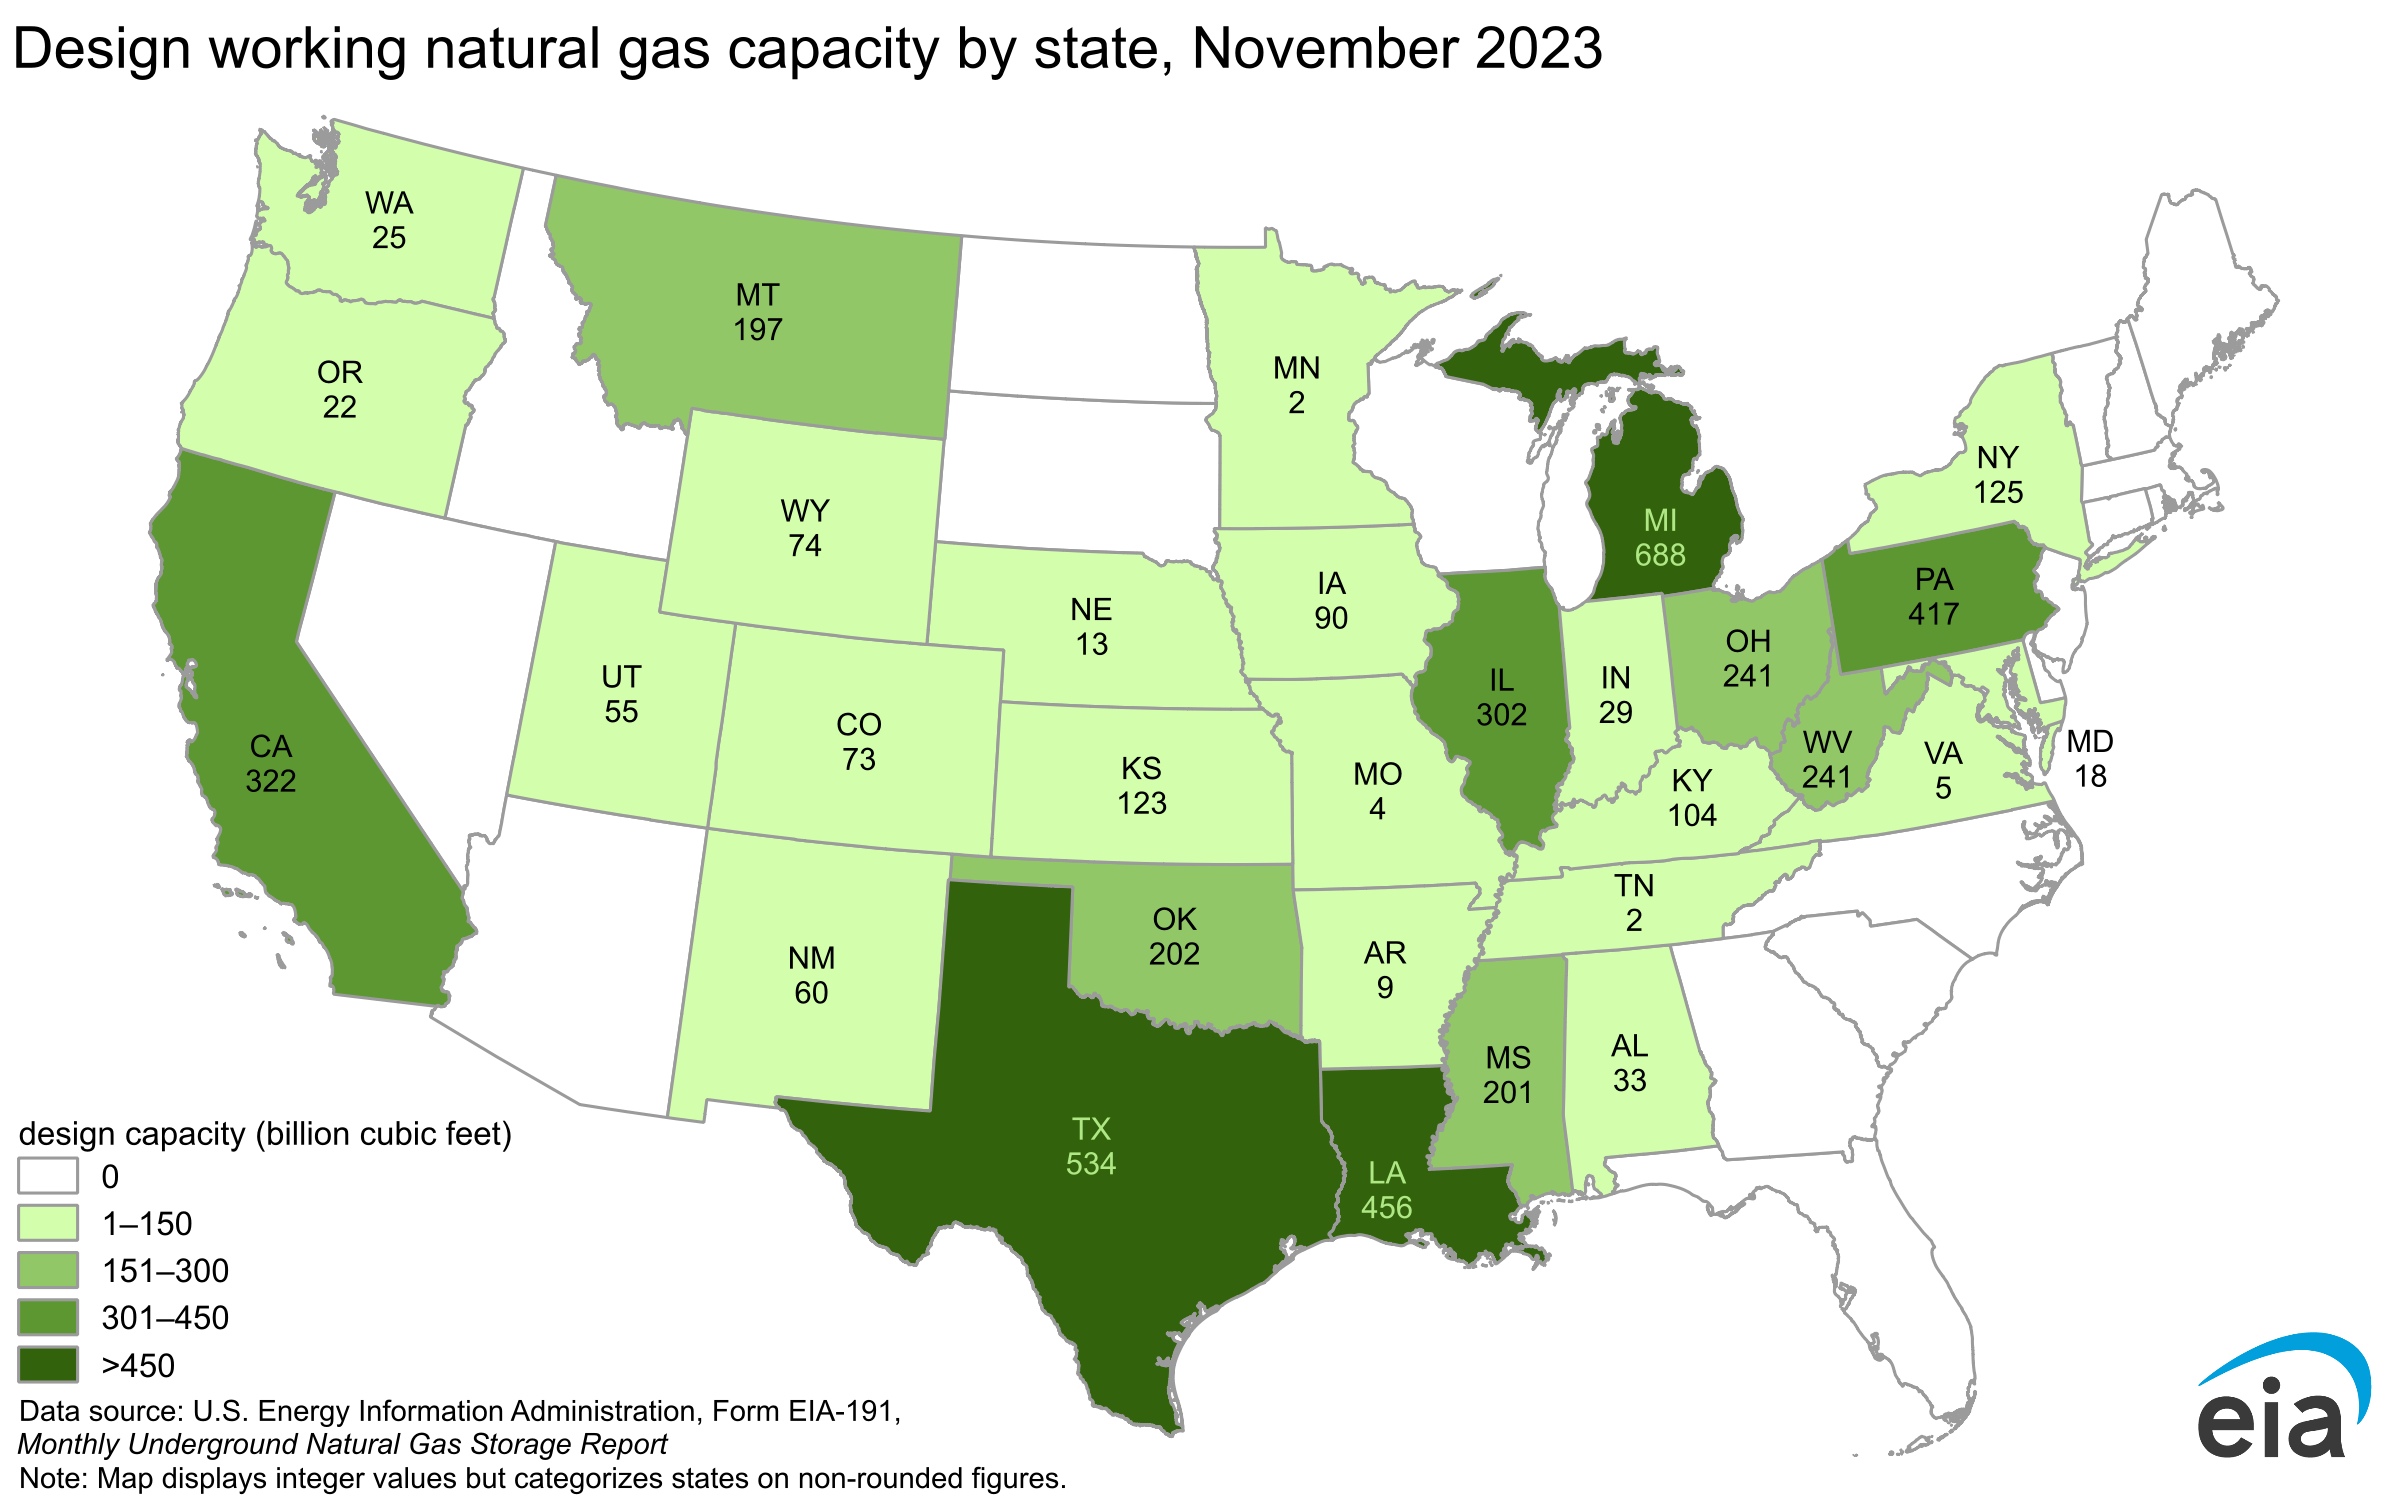
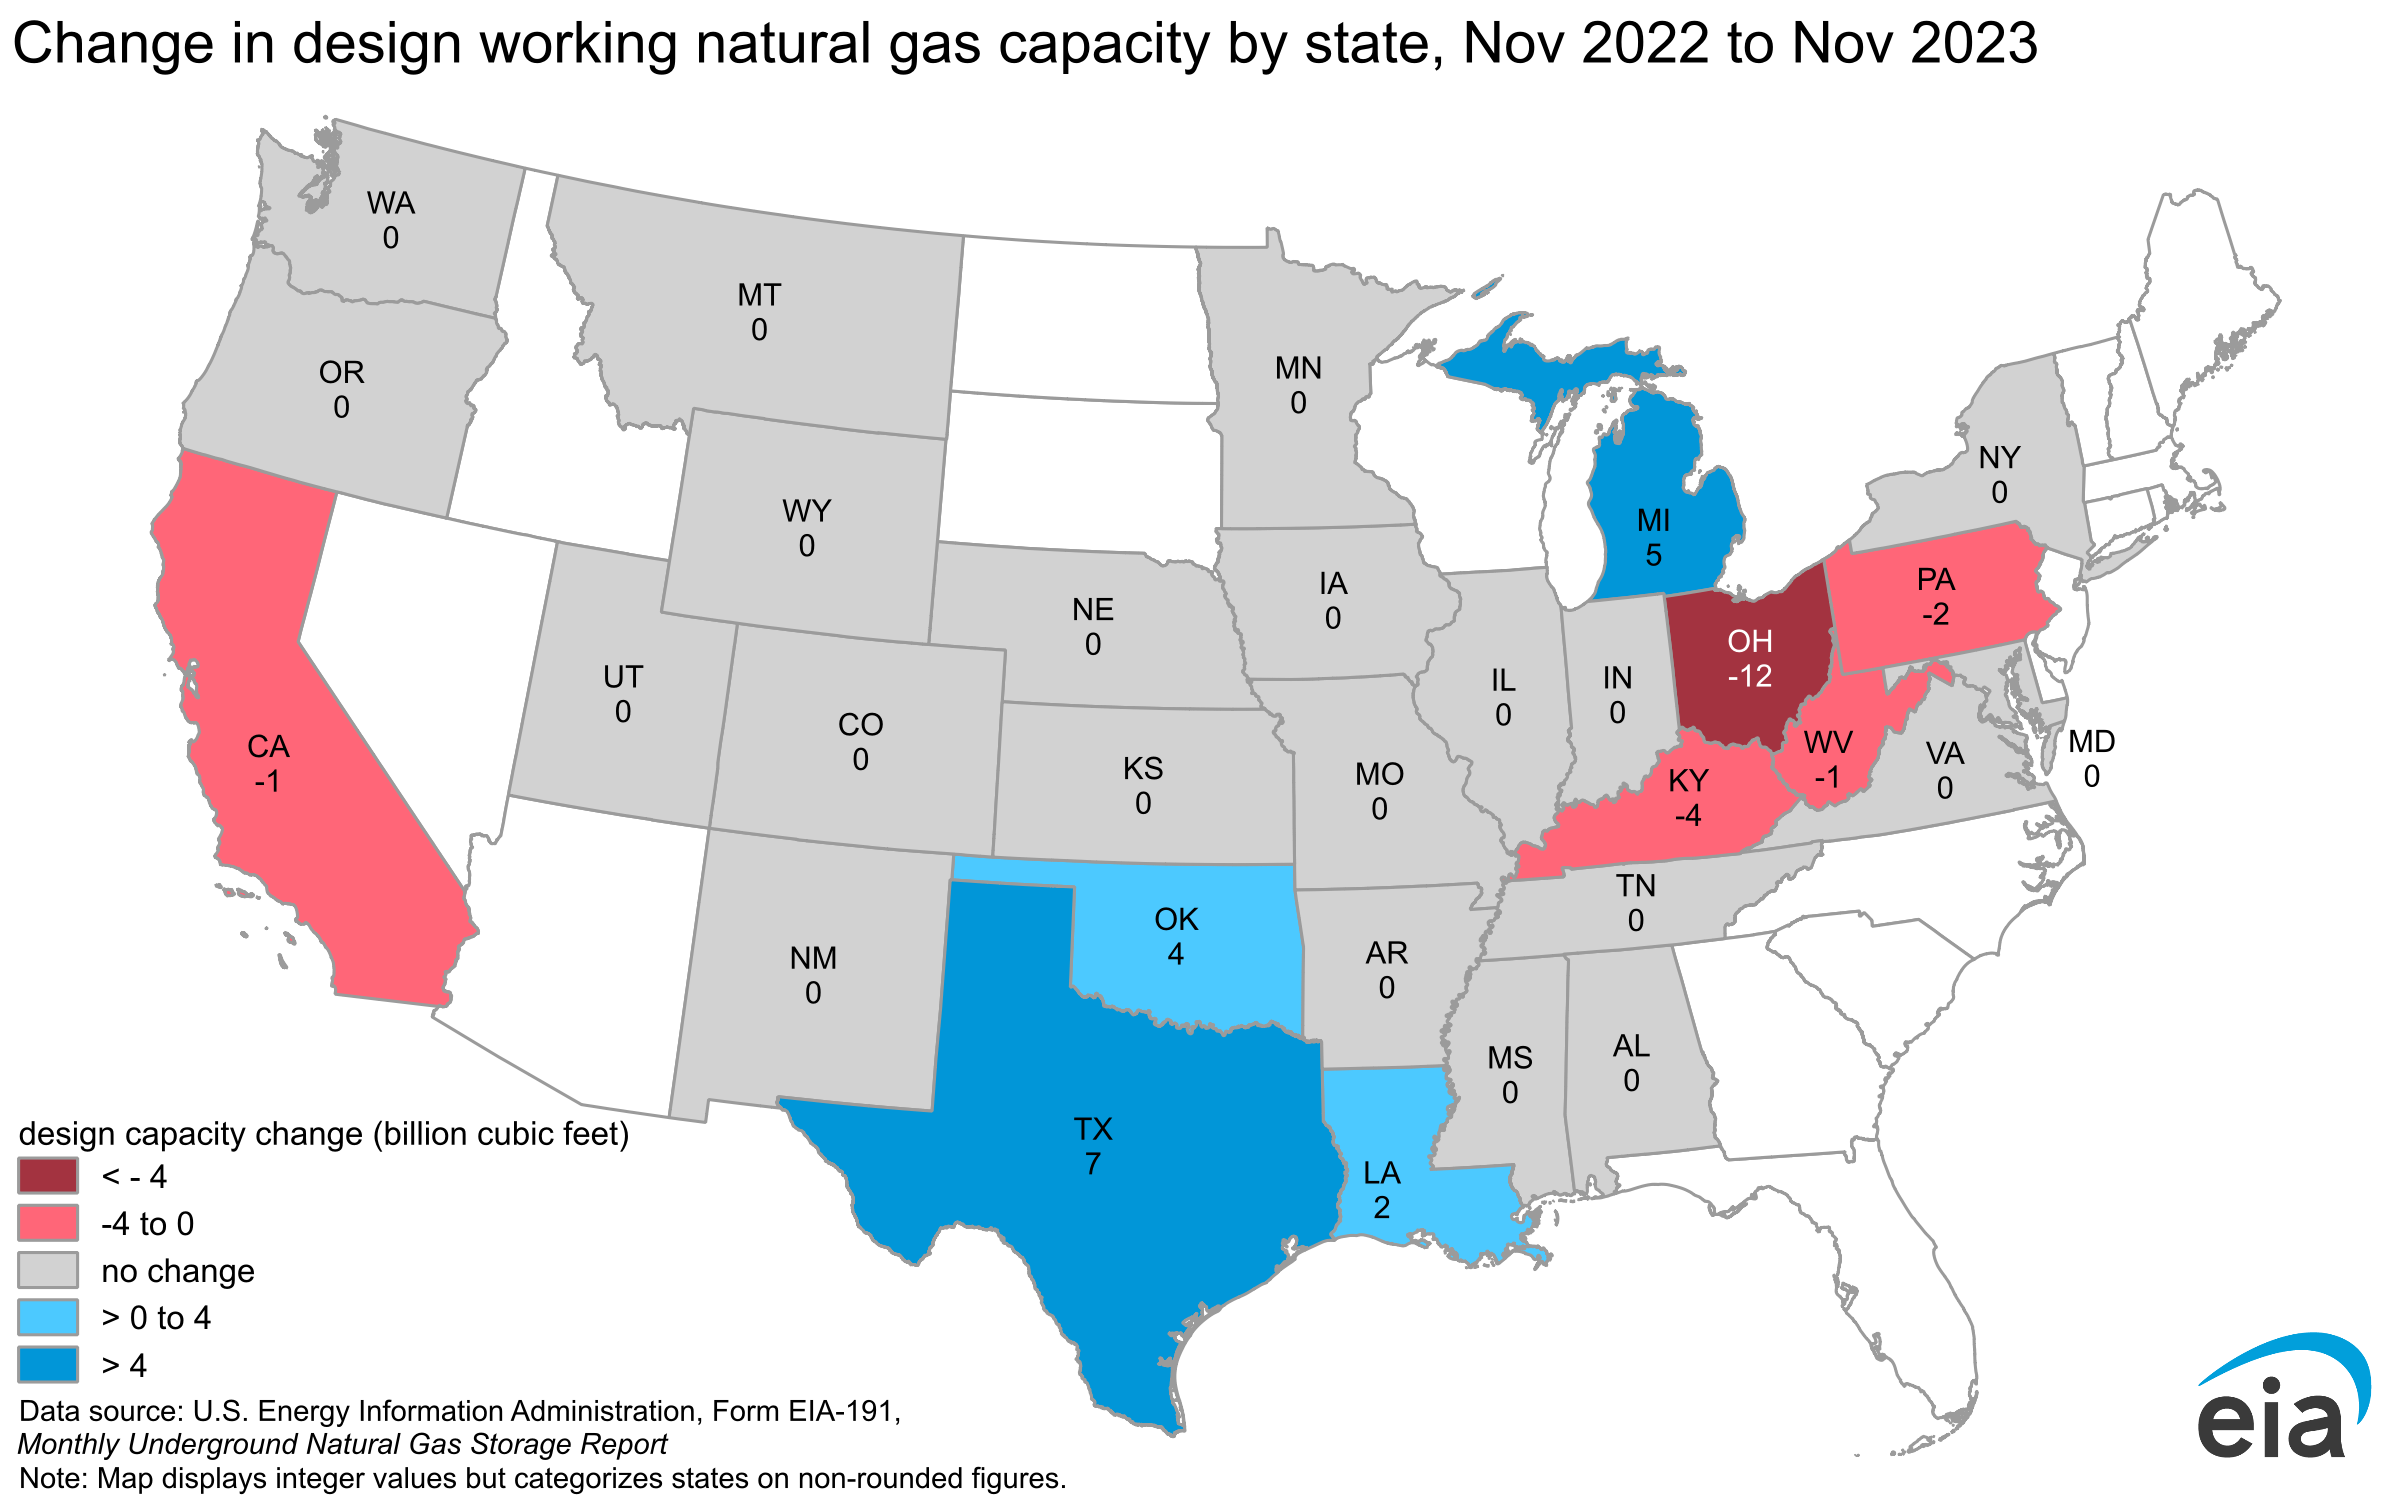
Natural gas design capacity was down in 2021, primarily driven by reductions in the Pacific region. Design capacity of underground natural gas storage facilities in the Lower 48 states declined by 1.3%, or 40 billion cubic feet (Bcf), in the period ending November 2021 compared with the period ending November 2020. Declines in the Pacific region totaled 50 Bcf, while the Midwest and Mountain regions reported much smaller decreases in working gas design capacity. Capacity increases in the South Central region offset some of the decreases reported elsewhere.
- In the Pacific region, Pacific Gas and Electric (PG&E) reduced its working natural gas design capacity by 51 Bcf, accounting for the entire decrease in working natural gas capacity in the region in 2021, but capacity increases in Oregon partially offset this reduction. The reduction in working natural gas capacity resulted from a reclassification of working natural gas to base gas in June 2021. The reclassification and resulting decrease in working natural gas capacity represented a permanent shift in how PG&E will operate its storage fields to ensure system reliability rather than to act as a commodity price management tool. Although the reclassification reduced working natural gas capacity by about 50% of its previous level, the total natural gas storage capacity—base plus working natural gas capacity—remained essentially unchanged.
- Working natural gas design capacity increased by10 Bcf in the South Central region. Mississippi River Transmission (MRT) increased its working natural gas capacity by 8.5 Bcf in 2021. The Federal Energy Regulatory Commission authorized MRT’s reclassification of base to working natural gas based on MRT’s improved understanding of the geology of its natural gas storage facility. In addition, the Egan Hub Partners added 1.9 Bcf of working natural gas capacity at its Egan Storage Dome facility.
Demonstrated peak capacity decreased in each of the regions in the Lower 48 states.
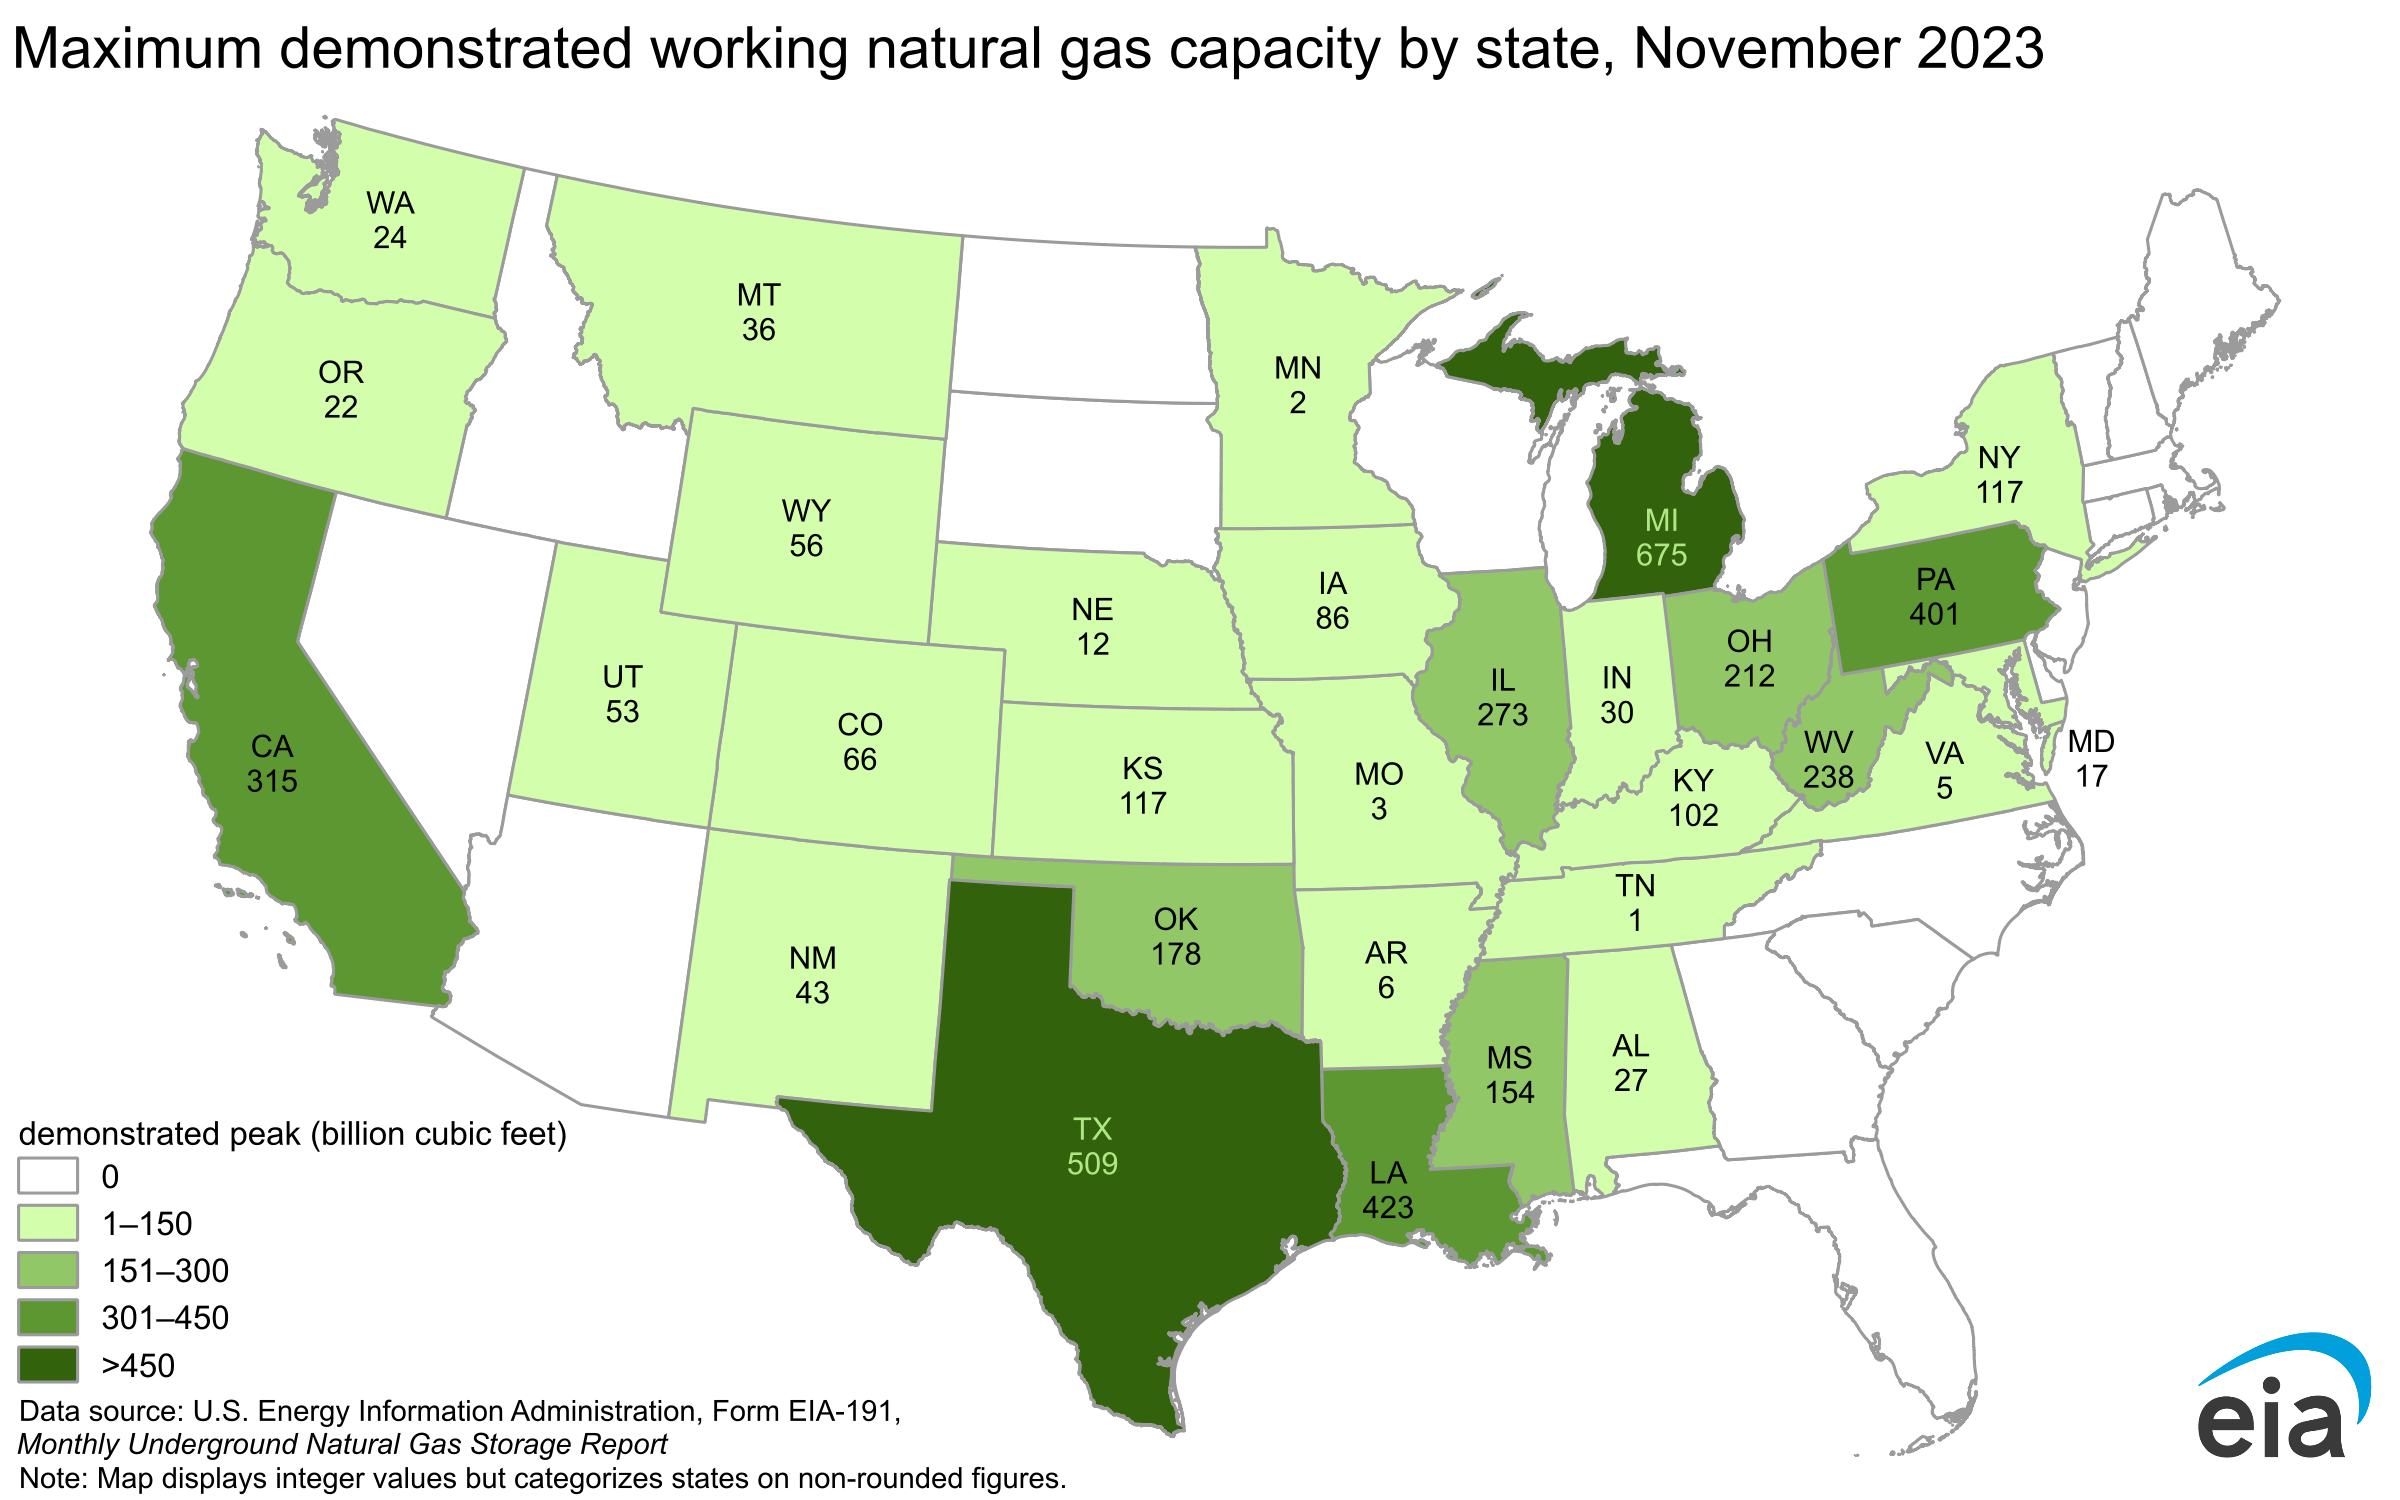
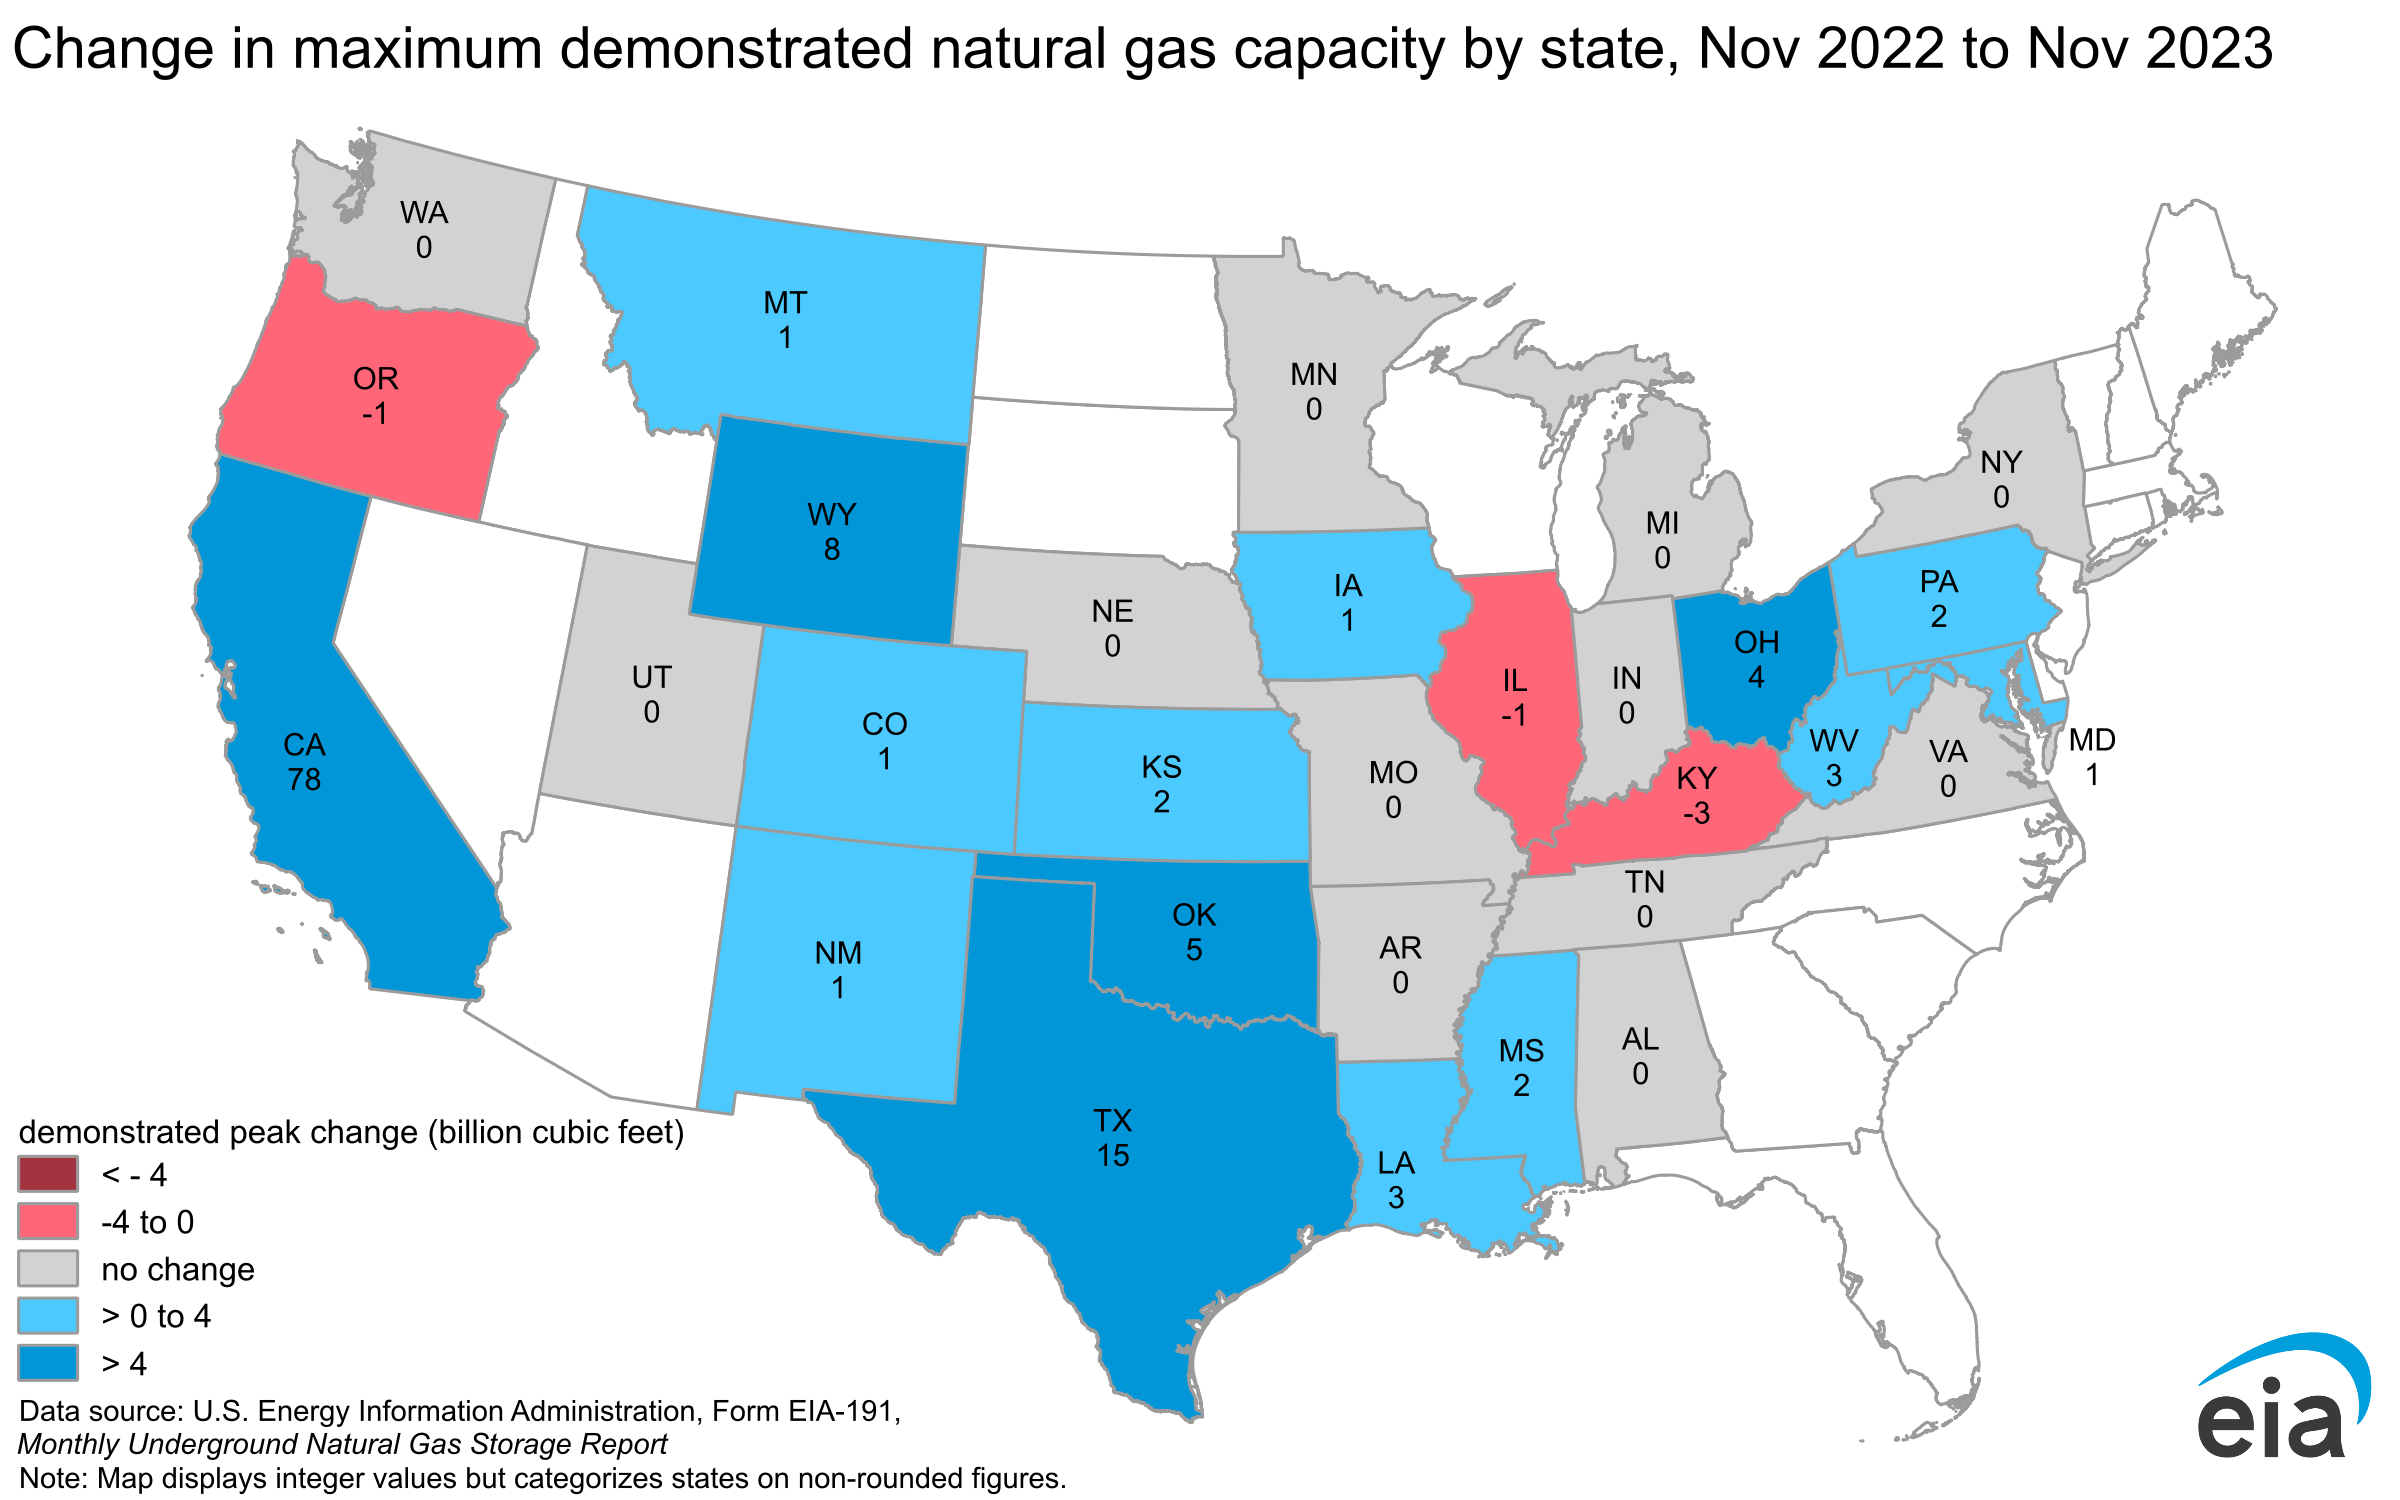
Demonstrated peak capacity fell 0.8%, or 57 Bcf, for the Lower 48 states as of the November 2021 report period (from December 2016 through November 2021) compared with the November 2020 report period (from December 2015 through November 2020). The November 2021 report period is the second year in a row—and the fourth in the last five years—with a year-over-year decrease in demonstrated peak capacity. The largest decreases occurred in the South Central and Pacific regions, where demonstrated peak capacity fell 27 Bcf and 11 Bcf, respectively. The Mountain region reported the third-largest decrease in percentage terms (2.4%), and declines were smallest in the East and Midwest regions.
The natural gas storage industry’s need for new capacity to balance the natural gas market has been influenced by offsetting trends in recent years.
Some market factors likely contributing to less need for incremental storage capacity:
- Overall higher levels of natural gas production lowered natural gas prices and enabled some customers to meet their natural gas supply needs without, for the most part, using natural gas storage services.
- Increased utilization of existing high-deliverability storage capacity meant some customers could get the supply and risk management services they needed without needing to sign for incremental capacity.
- Increased pipeline capacity and interconnectivity helped customers optimize buying and transporting natural gas.
- Natural gas demand grew slightly in the residential and commercial sectors.
- Small seasonal differences between the average price of winter and summer natural gas—at times—resulted in unfavorable economic incentives for buying physical natural gas and incurring storage service-related carrying charges. Low seasonal spreads during some years, due in part to rapid shale gas production growth and sometimes weather, may have moderated storage capacity expansion.
However, other energy market changes likely signaled greater needs for storage capacity, especially flexible, high-deliverability storage, including:
- Ongoing penetration of intermittent sources of generation such as wind and grid-scale photovoltaic electricity
- Balancing flexible receipts and deliveries to the growing South Central region pipeline and LNG export markets.
- Supporting fast-ramp supply needs for natural gas-fired generators
- Providing a physical hedge against rising natural gas prices and increased volatility
Working natural gas in storage ended the 2021 refill season 3% below the five-year average. Increased natural gas consumption slowed net injections into working natural gas storage in 2021, despite increased natural gas production. Increased electric power and export demand for natural gas reduced injections into storage. The reclassifications reported by PG&E lowered working gas levels by 51 Bcf, which resulted in an apparent decrease in net injection activity during the refill season. Nevertheless, 57 natural gas storage fields established new demonstrated peak capacities in 2021. In contrast, 134 fields set their previous peak levels between December 2015 and November 2016 (a period no longer included in the five-year range), which reduced demonstrated peak capacity.
| Demonstrated peak capacity1 | Design capacity2 | Demonstrated peak capacity share of design capacity3 | ||||||||||||||||||||||||||||||||||||||||||||||||||||||||||||||||||||||||||||||||||||||||||||||||
|---|---|---|---|---|---|---|---|---|---|---|---|---|---|---|---|---|---|---|---|---|---|---|---|---|---|---|---|---|---|---|---|---|---|---|---|---|---|---|---|---|---|---|---|---|---|---|---|---|---|---|---|---|---|---|---|---|---|---|---|---|---|---|---|---|---|---|---|---|---|---|---|---|---|---|---|---|---|---|---|---|---|---|---|---|---|---|---|---|---|---|---|---|---|---|---|---|---|---|
| Region | (Dec 2015 – Nov 2020) | (Dec 2016 – Nov 2021) | percent change | Nov 2020 | Nov 2021 | percent change | Nov 2020 | Nov 2021 | ||||||||||||||||||||||||||||||||||||||||||||||||||||||||||||||||||||||||||||||||||||||||||
| East | 991 | 984 | -0.7% | 1,065 | 1,065 | 0.0% | 93% | 92% | ||||||||||||||||||||||||||||||||||||||||||||||||||||||||||||||||||||||||||||||||||||||||||
| Midwest | 1,186 | 1,180 | -0.5% | 1,221 | 1,220 | 0.0% | 97% | 97% | ||||||||||||||||||||||||||||||||||||||||||||||||||||||||||||||||||||||||||||||||||||||||||
| Mountain | 267 | 261 | -2.4% | 472 R | 471 | 0.0% | 57% | 55% | ||||||||||||||||||||||||||||||||||||||||||||||||||||||||||||||||||||||||||||||||||||||||||
| Pacific4 | 370 | 359 | -3.0% | 419 R | 369 | -11.9% | 88% | 97% | ||||||||||||||||||||||||||||||||||||||||||||||||||||||||||||||||||||||||||||||||||||||||||
| South Central | 1,439 | 1,412 | -1.9% | 1,542 R | 1,553 | 0.7% | 93% | 91% | ||||||||||||||||||||||||||||||||||||||||||||||||||||||||||||||||||||||||||||||||||||||||||
| Nonsalt | 1,011 | 999 | -1.2% | 1,062 R | 1,071 | 0.8% | 95% | 93% | ||||||||||||||||||||||||||||||||||||||||||||||||||||||||||||||||||||||||||||||||||||||||||
| Salt | 428 | 413 | -3.5% | 480 | 482 | 0.3% | 89% | 86% | ||||||||||||||||||||||||||||||||||||||||||||||||||||||||||||||||||||||||||||||||||||||||||
| Lower 48 | 4,253 | 4,196 | -1.3% | 4,718 R | 4,678 | -0.8% | 90% | 90% | ||||||||||||||||||||||||||||||||||||||||||||||||||||||||||||||||||||||||||||||||||||||||||
|
Data source: U.S. Energy Information Administration, Monthly Natural Gas Underground Storage Report Note: Design capacity information for all underground storage facilities, including inactive fields, is available in the Natural Gas Annual Respondent Query System. Totals and calculations may not equal the sum of the components because of independent rounding. Information about storage regions is available in The Basics of Underground Natural Gas Storage. Mentions of specific companies in this report include only information that is publicly available on our website or on the Federal Energy Regulatory Commission (FERC) dockets. The symbol R indicates that figures have been revised. 1 Demonstrated peak capacity, otherwise known as the maximum demonstrated working natural gas volume, is the sum of the highest storage inventory levels of working natural gas observed in each distinct storage reservoir during the previous five-year period as reported by the operator on Form EIA-191, Monthly Underground Natural Gas Storage Report. The timing of the peaks for different facilities do not need to coincide. Inactive fields are not included in estimates of working natural gas capacity. 2 Design capacity is an estimate of a natural gas facility's physical working natural gas capacity as reported by the operator on Form EIA-191, Monthly Underground Natural Gas Storage Report. It represents the sum of all fields' capacities at a point in time. It is a measure based on the physical characteristics of the reservoir, installed equipment, and operating procedures particular to the site that are often certified by federal or state regulators. Inactive fields are not included in estimates of working natural gas capacity. 3 Demonstrated peak capacity in some cases exceeds 100% of design capacity because design capacity limits may differ from actual capacity limits in storage fields, as determined by the facility operator and local regulations. 4 The design capacity of Southern California Gas Company’s Aliso Canyon field was included in this report and in the Pacific region totals at 86.2 billion cubic feet, as publicly reported on Form EIA-191. The authorized working natural gas capacity of this facility may be lower because of ongoing operational constraints. |
||||||||||||||||||||||||||||||||||||||||||||||||||||||||||||||||||||||||||||||||||||||||||||||||||

| Demonstrated peak capacity1 | Design capacity2 | Demonstrated peak share of design capacity3 | ||||||||||||||||||||||||||||||||||||||||||||||||||||||||||||||||||||||||||||||||||||||||||||||||
|---|---|---|---|---|---|---|---|---|---|---|---|---|---|---|---|---|---|---|---|---|---|---|---|---|---|---|---|---|---|---|---|---|---|---|---|---|---|---|---|---|---|---|---|---|---|---|---|---|---|---|---|---|---|---|---|---|---|---|---|---|---|---|---|---|---|---|---|---|---|---|---|---|---|---|---|---|---|---|---|---|---|---|---|---|---|---|---|---|---|---|---|---|---|---|---|---|---|---|
| Region | State | (Dec 2015 - Nov 2020) |
(Dec 2016 - Nov 2021) |
Change | Nov 2020 | Nov 2021 | Change | Nov 2020 | Nov 2021 | |||||||||||||||||||||||||||||||||||||||||||||||||||||||||||||||||||||||||||||||||||||||||
| East | PA | 402 | 399 | -2 | 418 | 418 | 0 | 96% | 96% | |||||||||||||||||||||||||||||||||||||||||||||||||||||||||||||||||||||||||||||||||||||||||
| WV | 236 | 236 | 0 | 243 | 243 | 0 | 96% | 97% | ||||||||||||||||||||||||||||||||||||||||||||||||||||||||||||||||||||||||||||||||||||||||||
| MD | 16 | 16 | 0 | 18 | 18 | 0 | 90% | 90% | ||||||||||||||||||||||||||||||||||||||||||||||||||||||||||||||||||||||||||||||||||||||||||
| VA | 5 | 5 | 0 | 5 | 5 | 0 | 107% | 107% | ||||||||||||||||||||||||||||||||||||||||||||||||||||||||||||||||||||||||||||||||||||||||||
| OH | 210 | 208 | -3 | 253 | 253 | 0 | 83% | 83% | ||||||||||||||||||||||||||||||||||||||||||||||||||||||||||||||||||||||||||||||||||||||||||
| NY | 121 | 119 | -2 | 127 | 127 | 0 | 94% | 95% | ||||||||||||||||||||||||||||||||||||||||||||||||||||||||||||||||||||||||||||||||||||||||||
| Total | 991 | 984 | -7 | 1,065 | 1,065 | 0 | 93% | 93% | ||||||||||||||||||||||||||||||||||||||||||||||||||||||||||||||||||||||||||||||||||||||||||
| Midwest | IL | 274 | 274 | 0 | 301 | 301 | 0 | 90% | 91% | |||||||||||||||||||||||||||||||||||||||||||||||||||||||||||||||||||||||||||||||||||||||||
| IA | 84 | 85 | 1 | 90 | 90 | 0 | 91% | 93% | ||||||||||||||||||||||||||||||||||||||||||||||||||||||||||||||||||||||||||||||||||||||||||
| MN | 2 | 2 | 0 | 2 | 2 | 0 | 107% | 108% | ||||||||||||||||||||||||||||||||||||||||||||||||||||||||||||||||||||||||||||||||||||||||||
| TN | 2 | 2 | 0 | 2 | 2 | 0 | 84% | 84% | ||||||||||||||||||||||||||||||||||||||||||||||||||||||||||||||||||||||||||||||||||||||||||
| IN | 31 | 30 | -1 | 30 | 30 | 0 | 100% | 103% | ||||||||||||||||||||||||||||||||||||||||||||||||||||||||||||||||||||||||||||||||||||||||||
| MO | 7 | 7 | 0 | 4 | 4 | 0 | 188% | 188% | ||||||||||||||||||||||||||||||||||||||||||||||||||||||||||||||||||||||||||||||||||||||||||
| KY | 108 | 105 | -3 | 108 | 108 | 0 | 100% | 100% | ||||||||||||||||||||||||||||||||||||||||||||||||||||||||||||||||||||||||||||||||||||||||||
| MI | 680 | 676 | -3 | 684 | 684 | 0 | 99% | 99% | ||||||||||||||||||||||||||||||||||||||||||||||||||||||||||||||||||||||||||||||||||||||||||
| Total | 1,186 | 1,180 | -6 | 1,221 | 1,220 | 0 | 97% | 97% | ||||||||||||||||||||||||||||||||||||||||||||||||||||||||||||||||||||||||||||||||||||||||||
| Mountain | MT | 40 | 40 | -1 | 197 | 197 | 0 | 20% | 20% | |||||||||||||||||||||||||||||||||||||||||||||||||||||||||||||||||||||||||||||||||||||||||
| NE | 12 | 12 | 0 | 13 | 13 | 0 | 109% | 98% | ||||||||||||||||||||||||||||||||||||||||||||||||||||||||||||||||||||||||||||||||||||||||||
| UT | 53 | 53 | 0 | 55 | 55 | 0 | 96% | 96% | ||||||||||||||||||||||||||||||||||||||||||||||||||||||||||||||||||||||||||||||||||||||||||
| NM | 50 | 46 | -4 | 60 | 60 | 0 | 83% | 84% | ||||||||||||||||||||||||||||||||||||||||||||||||||||||||||||||||||||||||||||||||||||||||||
| CO | 63 | 63 | 0 | 73 | 73 | 0 | 83% | 87% | ||||||||||||||||||||||||||||||||||||||||||||||||||||||||||||||||||||||||||||||||||||||||||
| WY | 49 | 48 | 0 | 74 | 74 | 0 | 61% | 66% | ||||||||||||||||||||||||||||||||||||||||||||||||||||||||||||||||||||||||||||||||||||||||||
| Total | 267 | 261 | -6 | 472 R | 471 | 0 | 55% | 57% | ||||||||||||||||||||||||||||||||||||||||||||||||||||||||||||||||||||||||||||||||||||||||||
| Pacific | WA | 24 | 24 | 0 | 25 | 25 | 0 | 96% | 96% | |||||||||||||||||||||||||||||||||||||||||||||||||||||||||||||||||||||||||||||||||||||||||
| OR | 23 | 23 | 0 | 20 | 21 | 1 | 111% | 115% | ||||||||||||||||||||||||||||||||||||||||||||||||||||||||||||||||||||||||||||||||||||||||||
| CA4 | 323 | 312 | -11 | 374 | 323 | -51 | 96% | 86% | ||||||||||||||||||||||||||||||||||||||||||||||||||||||||||||||||||||||||||||||||||||||||||
| Total | 370 | 359 | -11 | 419 | 369 | -50 | 97% | 88% | ||||||||||||||||||||||||||||||||||||||||||||||||||||||||||||||||||||||||||||||||||||||||||
| South Central | MS | 165 | 157 | -8 | 202 | 202 | 0 | 81% | 82% | |||||||||||||||||||||||||||||||||||||||||||||||||||||||||||||||||||||||||||||||||||||||||
| AR | 5 | 5 | 0 | 9 | 9 | 0 | 57% | 57% | ||||||||||||||||||||||||||||||||||||||||||||||||||||||||||||||||||||||||||||||||||||||||||
| KS | 118 | 115 | -3 | 123 | 123 | 0 | 96% | 96% | ||||||||||||||||||||||||||||||||||||||||||||||||||||||||||||||||||||||||||||||||||||||||||
| AL | 27 | 27 | -1 | 33 | 33 | 0 | 80% | 82% | ||||||||||||||||||||||||||||||||||||||||||||||||||||||||||||||||||||||||||||||||||||||||||
| LA | 431 | 423 | -7 | 451 | 461 | 10 | 95% | 96% | ||||||||||||||||||||||||||||||||||||||||||||||||||||||||||||||||||||||||||||||||||||||||||
| OK | 186 | 180 | -7 | 198 | 198 | 0 | 95% | 95% | ||||||||||||||||||||||||||||||||||||||||||||||||||||||||||||||||||||||||||||||||||||||||||
| TX | 506 | 505 | -1 | 526 | 527 | 0 | 96% | 96% | ||||||||||||||||||||||||||||||||||||||||||||||||||||||||||||||||||||||||||||||||||||||||||
| Total | 1,439 | 1,412 | -27 | 1,542 R | 1,553 | 10 | 93% | 93% | ||||||||||||||||||||||||||||||||||||||||||||||||||||||||||||||||||||||||||||||||||||||||||
| Lower 48 | 4,253 | 4,196 | -57 | 4,718 R | 4,678 | -40 | 90% | 90% | ||||||||||||||||||||||||||||||||||||||||||||||||||||||||||||||||||||||||||||||||||||||||||
|
Data source: U.S. Energy Information Administration, Form EIA-191, Monthly Underground Natural Gas Storage Report Note: Design capacity information for all facilities, including inactive fields, is available in the Natural Gas Annual Respondent Query System. Totals and calculations may not equal the sum of the components because of independent rounding. Information about storage regions is available in The Basics of Underground Natural Gas Storage. Mentions of specific companies in this report include only information that is publicly available in our query system. 1 Demonstrated peak capacity, otherwise known as the maximum demonstrated working natural gas volume, is the sum of the highest storage inventory levels of working natural gas observed in each distinct storage reservoir during the previous five-year period as reported by the operator on the Form EIA-191, Monthly Underground Natural Gas Storage Report. The timing of the peaks for different facilities do not need to coincide. Inactive fields are not included in estimates of working natural gas capacity. 2 Design capacity is an estimate of a natural gas facility's physical working natural gas capacity as reported by the operator on the Form EIA-191, Monthly Underground Natural Gas Storage Report. It represents the sum of all fields' capacities at a point in time. It is a measure based on the physical characteristics of the reservoir, installed equipment, and operating procedures particular to the site that are often certified by federal or state regulators. Inactive fields are not included in estimates of working natural gas capacity. 3 Peak capacity in some cases exceeds 100% of design capacity because design capacity limits may differ from actual capacity limits in storage fields, as determined by the facility operator and local regulations. Demonstrated maximum working natural gas volume more commonly exceeds design capacity in states with a smaller number of facilities and smaller total storage volumes. In instances where storage fields reduce working natural gas capacity, demonstrated peak capacity may exceed design capacity. 4 The design capacity of Southern California Gas Company’s Aliso Canyon field was included in this report and in the Pacific region totals at 86.2 billion cubic feet, as publicly reported on Form EIA-191. The authorized working natural gas capacity of this facility may be lower because of ongoing operational constraints. |
||||||||||||||||||||||||||||||||||||||||||||||||||||||||||||||||||||||||||||||||||||||||||||||||||
State-level design capacity decreased primarily in the Pacific region and increased in the South Central region. Design capacity reductions were reported in California. As mentioned earlier, working natural gas capacity at PG&E’s McDonald Island and Los Medanos facilities in California fell by 51 Bcf—the largest reduction in working natural gas capacity at any facility in the Lower 48 states. In contrast, Louisiana reported increases in working natural gas capacity totaling 10 Bcf at two facilities in the region.
State-level declines in demonstrated capacity occurred primarily in California and in several states of the South Central region. Nearly every state in the South Central region, except for Arkansas, reported declines in demonstrated peak capacity. In the Mountain region, New Mexico and Montana reported decreases in demonstrated peak capacity.