|
Download Data (XLS File) |
|
||||||||
|
||||||||
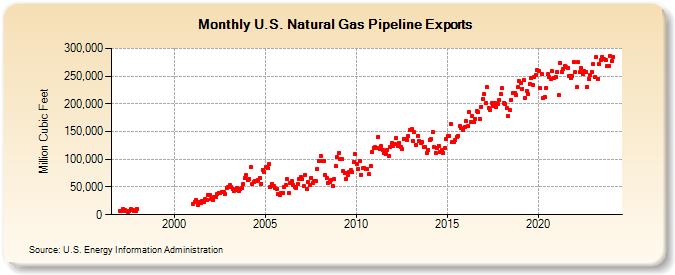
| U.S. Natural Gas Pipeline Exports (Million Cubic Feet) | ||||||||
| Year | Jan | Feb | Mar | Apr | May | Jun | Jul | Aug | Sep | Oct | Nov | Dec |
|---|---|---|---|---|---|---|---|---|---|---|---|---|
| 1997 | 6,424 | 6,846 | 10,601 | 8,211 | 6,284 | 5,741 | 6,380 | 10,101 | 9,288 | 6,613 | 7,361 | 10,968 |
| 2001 | 19,929 | 23,126 | 26,510 | 18,009 | 23,268 | 20,751 | 25,521 | 23,248 | 27,806 | 26,827 | 36,149 | 35,916 |
| 2002 | 28,835 | 26,591 | 32,483 | 31,740 | 37,576 | 39,327 | 39,426 | 40,905 | 40,952 | 36,495 | 48,942 | 49,118 |
| 2003 | 52,795 | 50,784 | 46,247 | 43,194 | 44,695 | 48,406 | 42,143 | 45,796 | 47,834 | 54,715 | 66,171 | 71,068 |
| 2004 | 61,908 | 64,634 | 85,376 | 56,277 | 59,059 | 60,439 | 61,405 | 61,887 | 66,966 | 55,845 | 80,824 | 77,051 |
| 2005 | 85,799 | 83,987 | 90,634 | 49,883 | 55,190 | 51,041 | 47,579 | 46,391 | 38,233 | 35,433 | 39,373 | 39,691 |
| 2006 | 50,022 | 53,188 | 63,872 | 39,599 | 56,968 | 60,110 | 53,267 | 49,099 | 48,843 | 55,708 | 64,854 | 67,490 |
| 2007 | 64,344 | 51,522 | 72,282 | 47,227 | 58,901 | 53,960 | 66,412 | 57,554 | 61,468 | 59,996 | 83,249 | 97,055 |
| 2008 | 106,460 | 96,635 | 97,418 | 71,478 | 65,493 | 57,847 | 59,730 | 62,163 | 52,197 | 63,897 | 87,288 | 103,438 |
| 2009 | 111,138 | 100,433 | 100,759 | 78,099 | 75,158 | 64,344 | 72,436 | 76,830 | 79,940 | 76,165 | 94,961 | 108,739 |
| 2010 | 91,632 | 82,732 | 97,639 | 72,086 | 83,795 | 85,009 | 82,009 | 82,235 | 72,811 | 88,069 | 113,969 | 120,010 |
| 2011 | 121,333 | 119,966 | 139,347 | 118,630 | 123,355 | 117,541 | 110,687 | 109,478 | 116,779 | 106,643 | 122,730 | 129,159 |
| 2012 | 124,265 | 128,295 | 138,549 | 123,132 | 130,168 | 122,741 | 118,355 | 136,793 | 137,362 | 135,559 | 142,292 | 153,018 |
| 2013 | 154,430 | 132,981 | 148,521 | 125,749 | 142,032 | 133,778 | 128,589 | 130,312 | 122,410 | 122,381 | 110,912 | 117,281 |
| 2014 | 134,746 | 135,827 | 149,455 | 121,877 | 112,175 | 119,828 | 124,462 | 112,513 | 116,987 | 112,156 | 120,814 | 136,932 |
| 2015 | 141,663 | 142,190 | 163,925 | 130,283 | 131,477 | 135,382 | 141,027 | 142,117 | 159,806 | 155,744 | 152,750 | 158,555 |
| 2016 | 168,470 | 159,426 | 184,816 | 167,789 | 178,375 | 166,551 | 172,923 | 187,458 | 185,222 | 173,455 | 194,922 | 208,993 |
| 2017 | 218,600 | 201,167 | 229,765 | 191,732 | 188,062 | 200,844 | 195,201 | 201,833 | 194,183 | 199,576 | 207,607 | 217,521 |
| 2018 | 227,758 | 201,968 | 199,901 | 193,227 | 177,289 | 188,431 | 207,736 | 219,909 | 220,355 | 216,758 | 230,180 | 240,989 |
| 2019 | 237,813 | 227,074 | 242,696 | 211,083 | 223,633 | 218,249 | 236,515 | 246,391 | 234,222 | 247,781 | 251,305 | 261,086 |
| 2020 | 260,106 | 228,425 | 253,130 | 210,266 | 212,994 | 229,442 | 252,930 | 247,748 | 244,279 | 258,632 | 247,493 | 248,884 |
| 2021 | 258,287 | 215,579 | 274,352 | 257,485 | 263,110 | 267,770 | 265,887 | 265,296 | 250,769 | 246,936 | 250,585 | 275,524 |
| 2022 | 257,045 | 229,662 | 274,958 | 256,922 | 265,217 | 253,100 | 259,426 | 257,816 | 231,086 | 244,505 | 251,165 | 257,355 |
| 2023 | 271,450 | 248,498 | 283,832 | 244,853 | 271,608 | 279,435 | 285,193 | 281,440 | 279,021 | 267,402 | 268,448 | 286,471 |
| 2024 | 277,608 | |||||||||||
| - = No Data Reported; -- = Not Applicable; NA = Not Available; W = Withheld to avoid disclosure of individual company data. |
| Release Date: 3/29/2024 |
| Next Release Date: 4/30/2024 |