Forecast overview
- Global oil production. Oil flows through the Strait of Hormuz continue to be limited causing oil storage to fill quickly in countries that rely on the waterway for exports. As a result, we estimate that Iraq, Saudi Arabia, Kuwait, UAE, Qatar, and Bahrain collectively shut in 7.5 million barrels per day (b/d) of crude oil production in March. We assess that production shut-ins will rise to 9.1 million b/d in April. In this outlook, we assume the conflict does not persist past April and that traffic through the Strait of Hormuz gradually resumes. Under those assumptions, we expect production shut-ins will fall to 6.7 million b/d in May and return close to pre-conflict levels in late 2026.
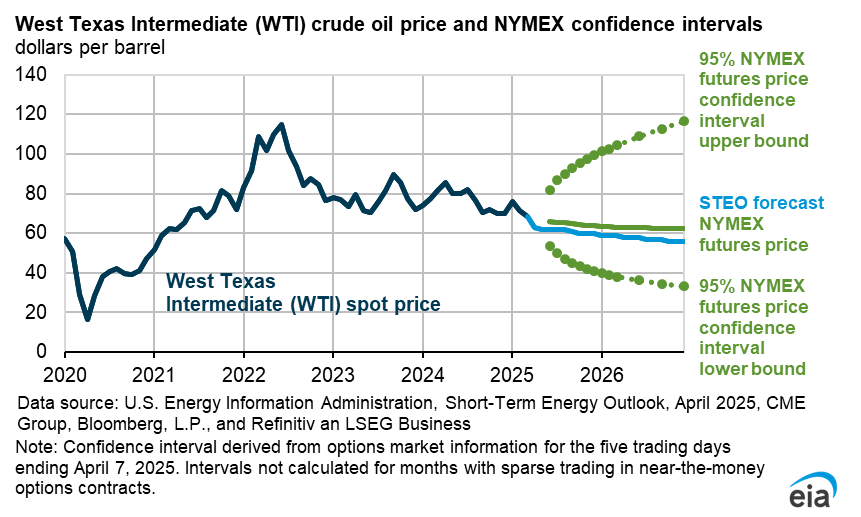
- Crude oil price forecast. The Brent crude oil spot price averaged $103 per barrel (b) in March, and we expect it to peak in the second quarter of 2026 (2Q26) at $115/b before easing as production shut-ins slowly abate. We maintain a risk premium on crude oil prices throughout the forecast period as we expect uncertainty around future supply disruptions to keep prices above pre-conflict levels. We forecast the Brent crude oil price will fall below $90/b in 4Q26 and average $76/b in 2027. This price forecast is highly dependent on our assumptions of both the duration of conflict in the Middle East and resulting outages in oil production.
- Brent-WTI spread. The spread between the Brent crude oil spot price and West Texas Intermediate (WTI) crude oil spot price increased, averaging $12/b in March as the conflict in the Middle East pushed the Brent spot price higher than WTI. The Brent spot price increased more sharply than the WTI spot price due to exposure to higher shipping costs and reduced oil flows between the Middle East and major consuming markets in Asia. The Brent-WTI spread in our forecast peaks at $15/b in April, when production disruptions are largest. We expect that the Brent-WTI spread will gradually decline as oil flows through the Strait of Hormuz resume and oil prices decline.
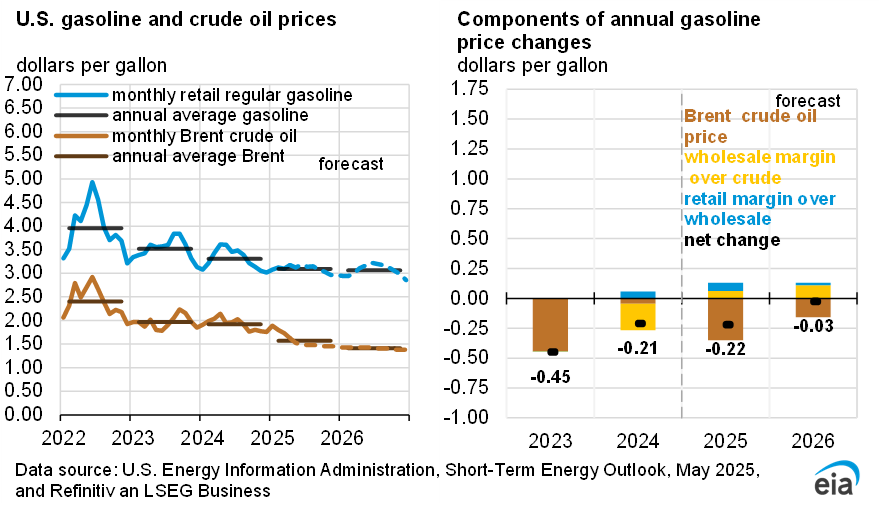
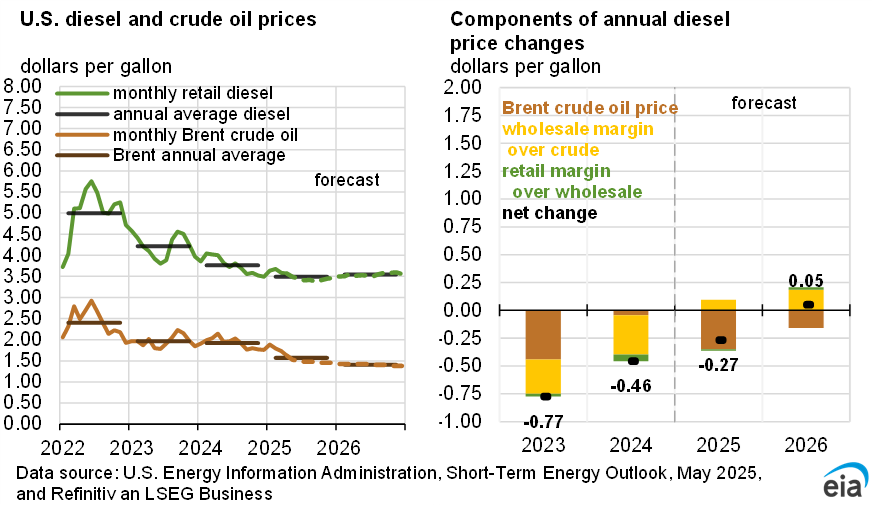
- Retail gasoline and diesel prices. Higher crude oil prices have led to higher gasoline and diesel prices, with diesel remaining particularly elevated due to tight global supplies and U.S. inventories remaining below the five-year (2021–2025) average. We forecast retail gasoline prices to peak at a monthly average of close to $4.30 per gallon (gal) in April and average more than $3.70/gal this year. Diesel prices peak at more than $5.80/gal in April and average $4.80/gal in 2026.
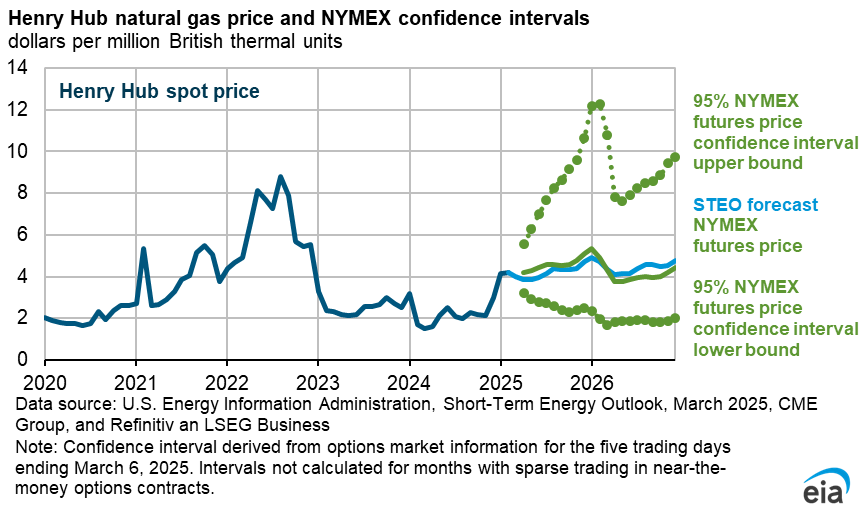
- LNG exports. The reduction in flows of liquefied natural gas (LNG) exports through the Strait of Hormuz have reduced global LNG supply and sharply increased the spread between the U.S. benchmark Henry Hub spot price and European and Asian import prices. U.S. LNG export facilities are running at near-peak capacity, exporting almost 18 billion cubic feet per day of natural gas in March, close to the record set in December 2025. With capacity utilization high, only very limited flexibility exists to increase exports. That flexibility comes from deferred maintenance, the pace of new project ramp-ups, and recent export authorization agreements.
- Natural gas inventories. Natural gas inventories ended the 2025–2026 withdrawal season (November–March) 3% above the five-year average, at just over 1,900 billion cubic feet (Bcf). On the back of natural gas production growth and very limited capacity to increase exports, we expect natural gas storage injections to outpace the five-year average and end October at 4,015 Bcf, 6% more than the five-year average.
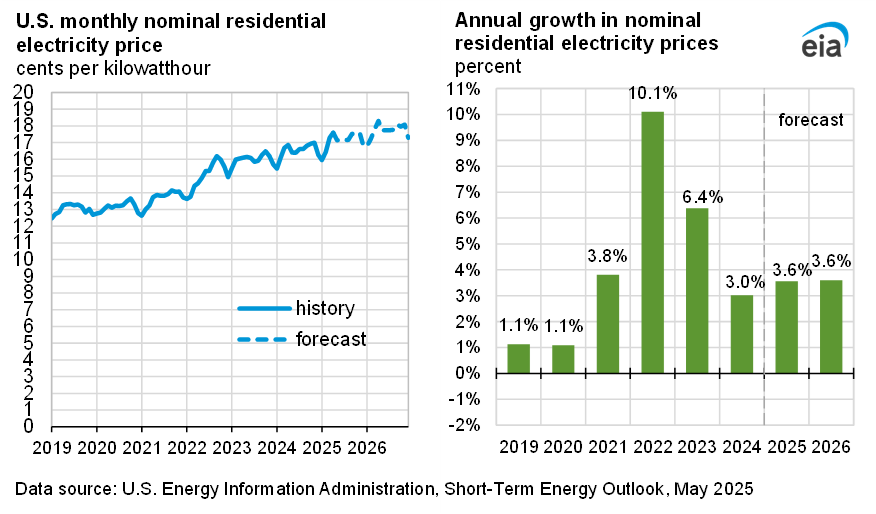
- Electricity demand. U.S. electricity demand rises in our forecast, with the commercial sector leading the growth. Electricity demand peaks during the summer months (June–September) as cooling needs increase. This summer we expect electric power demand from both the residential and commercial sectors to grow by 3% relative to last summer. Growth in the commercial sector reaches 6% in the summer of 2027, surpassing the residential sector’s 1% growth.
| Notable Forecast Changes | 2026 | 2027 |
|---|---|---|
The current STEO forecast was released April 7. |
||
| Brent crude oil spot price (dollars per barrel) | $96 | $76 |
| Previous forecast | $79 | $64 |
| Percentage change | 22% | 18% |
| Global oil inventory change (million barrels per day) | -0.3 | 3.3 |
| Previous forecast | 1.9 | 3.0 |
| Change | -2.2 | 0.3 |
| OPEC+. crude oil production (million barrels per day) | 41.7 | 45.0 |
| Previous forecast | 43.9 | 45.0 |
| Percentage change | -5.0% | -0.1% |
| Retail diesel price (dollars per gallon) | $4.80 | $4.11 |
| Previous forecast | $4.12 | $3.78 |
| Percentage change | 16.7% | 8.6% |
| Retail gasoline price (dollars per gallon) | $3.70 | $3.46 |
| Previous forecast | $3.34 | $3.18 |
| Percentage change | 10.6% | 9.0% |
You can find more information in the detailed table of forecast changes.