Corporate Goal Case, Annual Energy Outlook 2021 Issues in Focus
Executive Summary
This paper compares the Reference case in our Annual Energy Outlook 2021 (AEO2021) to a Corporate Goal case that models announced utility plans in addition to current laws and regulations as of October 2020.
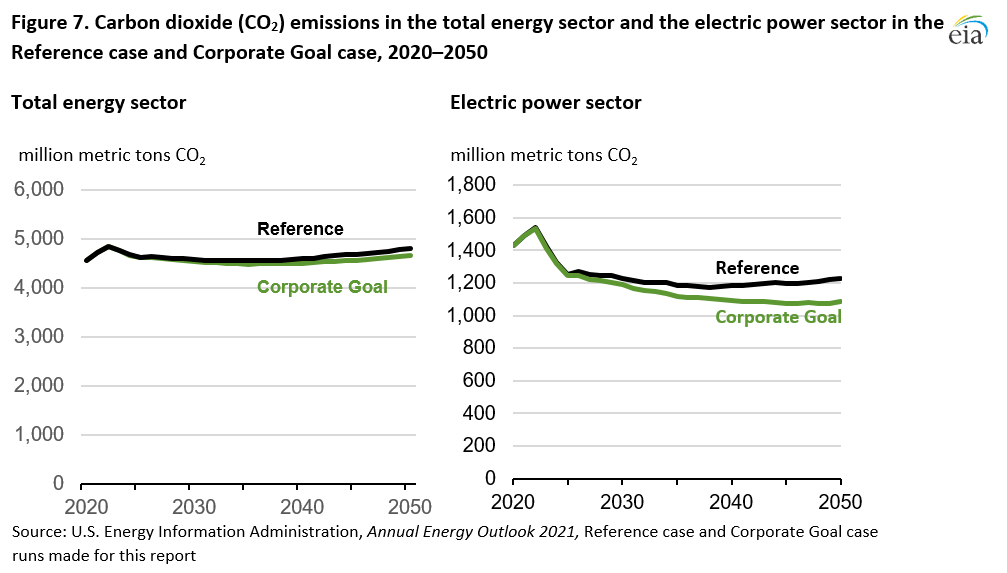
In 2050, carbon dioxide (CO2) emissions across the entire U.S. energy system are 2.9% lower in the Corporate Goal case than in the Reference case. This decrease in total emissions mostly follows an 11.6% decrease in CO2 emissions from the electric power sector in the Corporate Goal case compared with the Reference case because additional carbon-neutral generation resources contribute to a greater share of generation. Higher nuclear generation, as a result of fewer nuclear plant retirements, account for the higher carbon-neutral generation.
Our model identifies existing nuclear generation as one of the lowest-cost options for meeting clean energy or carbon reduction goals, which is why CO2 emissions are lower in the Corporate Goal case. Nuclear generation’s low cost is the result of nuclear plants’ operation and maintenance costs are typically less than the cost of building new low-carbon capacity. Electricity-related CO2 emissions across both cases diverge beginning in 2025.
Overall U.S. production of natural gas is 2.9% lower in the Corporate Goal case than in the Reference case. This lower level occurs because of the industrial sector’s consistent consumption of natural gas and increased natural gas exports as a result of lower natural gas prices, despite the significant reduction in natural gas used for power generation.
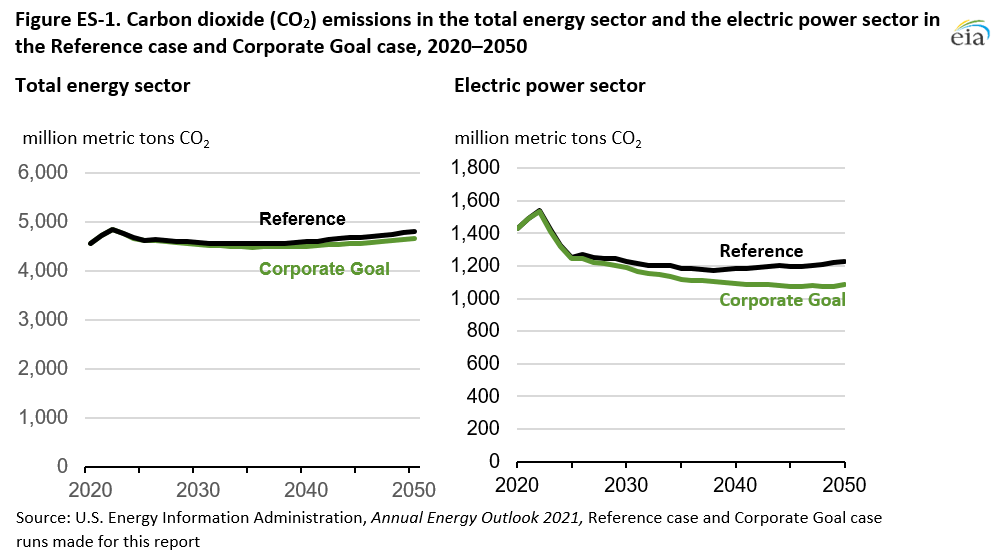
Before 2025, electricity-related CO2 emissions decline in both cases as a result of similar retirements of coal-fired generating units. Starting in 2025, factors such as continued low natural gas prices (compared with historical prices) and compliance with the Affordable Clean Energy Rule (ACE Rule) drive retirements of coal-fired generating units.1 After 2025, when the ACE Rule takes full effect, the rule requires remaining coal-fired generating plants to operate at higher utilization rates following the retirement of older, less-efficient coal plants, leaving only the most-efficient plants in operation. More projected generation from natural gas in the Reference case than in the Corporate Goal case results in slightly higher electricity-related CO2 emissions in the Reference case.
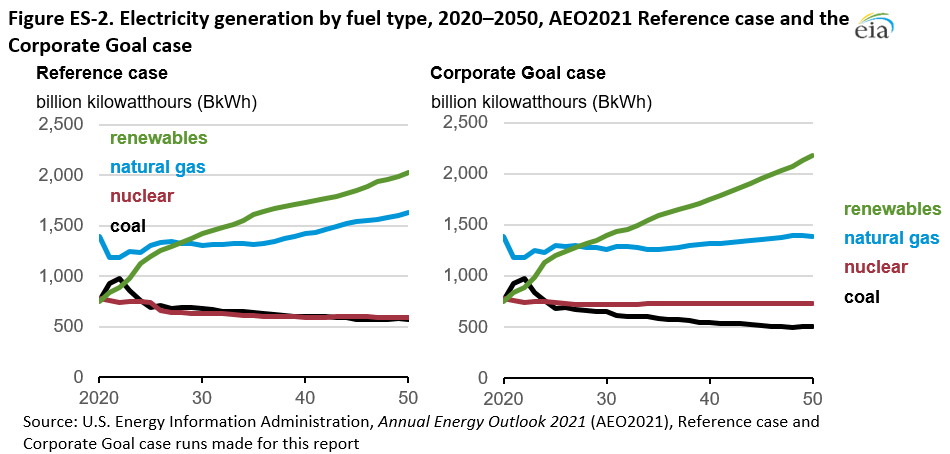
Because nuclear generation is a qualifying carbon-free source in the stated corporate goals, fewer nuclear plants retire in the Corporate Goal case. Nuclear generation in 2050 in the Corporate Goal case is 142 billion kilowatthours (BkWh), 24% more than in the Reference case. Generation from U.S. renewable resources in 2050 in the Corporate Goal case is 154 BkWh, 7.6% more than in the Reference case. High levels of both nuclear generation and renewables limit growth in natural gas-fired generation in the Corporate Goal case. The Corporate Goal case projects 240 BkWh (14.7%) less natural gas-fired generation and 66 BkWh (11.4%) less coal-fired generation in 2050 when compared with the Reference case.
Our Reference case reflects current laws and regulations, and it includes state-level renewable portfolio standards (RPS). Other states implement carbon-free generation standards, also called clean energy standards, which require 100% of electricity sales in the state to come from carbon-free technologies by a certain date.
In addition to following RPS, many utilities outline carbon reduction goals in integrated resource plans (IRPs), which are filed with the Public Utilities Commission (PUC), and announce carbon reduction goals in press releases and other documents. We do not include these announcements and plans in the Reference case.
The Corporate Goal case assumes that corporate commitments announced as of October 2020 will meet the stated reduction target by the stated target year. We made these projections using the National Energy Modeling System (NEMS), which balances energy supply and demand, accounting for economic competition across the various energy fuels and sources.
In the Corporate Goal case, we weight a utility’s carbon reduction goal by that utility’s sales in that state. We apply a linear growth rate for compliance, starting at 0% in 2020 and increasing to the target by the stated terminal date. If an existing state-level RPS is greater than the weighted utility carbon reduction goal, then we use the higher state-level goal in the Reference case.
Corporate Goal Case
In recent years, many utilities in the United States have made corporate commitments to voluntarily reduce their carbon emissions beyond legislated requirements. Many of these companies are generating more electricity from carbon-free sources and have been phasing out generation from fossil fuel-fired generating units. Although we model current laws and regulations as part of our long-term electricity projections for the Annual Energy Outlook 2021 (AEO2021) Reference case, we do not view corporate goals or integrated resource plans (IRPs) as binding governmental policy but rather as corporate goals subject to the influence of evolving market conditions. To illustrate the potential impacts of these corporate goals, we developed an alternative case in which we assume that these corporate goals are achieved.
By the end of 2020, 30 states and the District of Columbia had passed legislation establishing renewable portfolio standards (RPS). Several of these jurisdictions recently established more aggressive RPS policies than those enacted over the past 20 years, requiring carbon-free generation standards, also called clean energy standards. These standards require 100% of electricity sales to the state to come from carbon-free technologies. Appendix 1 outlines these standards.
Generation resources that qualify for RPS commonly include solar, wind, geothermal, municipal solid waste, and new and small-scale hydroelectric. Carbon-free generating technologies typically also include nuclear, existing large-scale conventional hydropower (also referred to as legacy hydro), and fossil fuel generation with carbon capture and sequestration technologies.
Utilities or their parent companies often announce corporate commitments, and in many cases, the utilities also reaffirm their commitments by filing IRPs with state public service commissions (PSCs) or public utility commissions (PUCs). These plans are commitments to reduce carbon dioxide (CO2) emissions from electricity generation by a certain percentage, generally from a level reached between 2000 and 2008, by some point in the future, generally between 2030 and 2050.
Although we do not model these stated corporate goals in the AEO2021 Reference case, we do include all specific generator retirements or planned additions reported to us on survey forms. In many cases, these reported capacity retirements or additions may align with utility corporate goals. In addition to planned retirements, we model generating unit retirements based on unit economics when a unit experiences three consecutive years of negative operating margins based on a variety of factors.2
Methodology
Corporate carbon reduction goals can take many forms. The AEO2021’s Corporate Goal case considers both the carbon reduction goals outlined in IRPs and the carbon reduction goals stated in press releases and other documents that utilities release to the public. We collected these carbon reduction goals through a thorough review of filed IRPs and announced commitments from investor-owned utilities (IOUs) as of October 2020. The Corporate Goal case assumes that any corporate commitment announced by an IOU that operates in the Lower 48 states will meet the stated target reduction by the stated target year. In particular, we assume:
- A utility’s state-level carbon reduction goal is weighted by the sales of that utility in that state.3
- A linear growth rate is used for corporate goal compliance, where each annual carbon reduction goal compliance target starts at 0% in 2020 and then increases to the stated target at the stated terminal date.
- If existing state-level RPS is greater than the weighted utility carbon reduction goal, then the Reference case uses the higher state-level goal.
- Announced planned retirements of existing generating capacity are consistent with the filed IRPs and other company announcements.
Results
Coal and nuclear retirements
The Corporate Goal case includes an additional 10.7 gigawatts (GW) of retired coal-fired capacity for a total of 121.8 GW. In the AEO2021 Reference case, we project that 111.1 GW of coal-fired generating capacity will retire by 2050 (Table 1). These retirements include 55.7 GW reported on Form EIA-860, Annual Electric Generator Report, and 55.5 GW of unplanned retirements that are modeled in NEMS as a result of plant economics. Only 42.3 GW of the coal-fired capacity retire in the Corporate Goal case because of modeled economics, and the remaining 79.6 GW of retirements are planned retirements. The 24 GW of additional planned retirements in the Corporate Goal case compared with the Reference case represent coal retirements included in announced utility plans that have not been officially reported on EIA surveys. However, about 13 GW of these retirements had been modeled in the Reference case based on economic conditions.
| Type of generator retirement | Reference case | Corporate Goal case | Difference |
|---|---|---|---|
| Modeled | 55.5 | 42.3 | -13.2 |
| Planned | 55.7 | 79.6 | 23.9 |
| Total | 111.1 | 121.8 | 10.7 |
| Source: U.S. Energy Information Administration, Annual Energy Outlook 2021, Reference case and Corporate Goal case runs made for this report. Note: Totals may not equal the sum of the components as a result of independent rounding. |
|||
In the Corporate Goal case, nuclear generation contributes to many utilities’ stated carbon-free generation goals. Nuclear retirements total 29 GW over the projection period in the Reference case, and nuclear plants retire as late as 2047. Nuclear retirements in the Corporate Goal case reach 11 GW in 2027, but the model does not retire any additional nuclear capacity during the rest of the projection period.
Electricity generation
The Corporate Goal case projects a different electricity-generation fuel mix over time compared with the Reference case (Figure 1). Dispatch decisions in the model occur on economic grounds subject to the limits of the case, and the modeled corporate goals are the only additional constraints to this case when compared with the Reference case.<4 In the Corporate Goal case, we project 142 billion kilowatthours (BkWh), or 24%, more nuclear generation in 2050 than in the Reference case. Fewer nuclear plants retire because nuclear generation and renewables help meet the carbon-free generation requirements and limit growth in natural gas-fired generation. The Corporate Goal case projects 240 BkWh (14.7%) less natural gas-fired generation and 66 BkWh (11.4%) less coal-fired generation in 2050 when compared with the Reference case. Generation from renewable sources increases by 154 BkWh (7.6%) by 2050 in the Corporate Goal case when compared with the Reference case.
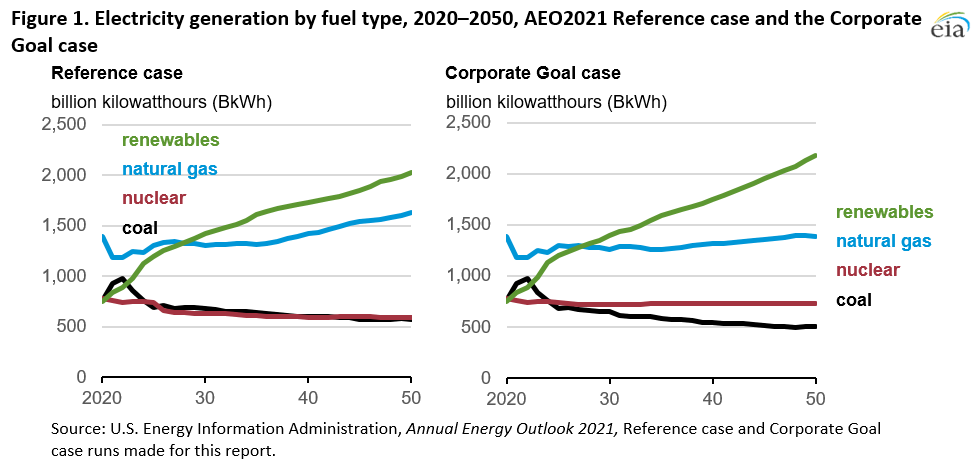
In the Corporate Goal case, maintaining existing nuclear generation is among the lowest-cost options for meeting clean energy or carbon reduction goals because existing nuclear plants typically have operation and maintenance costs that are less than the cost of building new low-carbon capacity. To meet projected load growth, as well as to replace generation from retired fossil-fueled generating units, newly added carbon-free generation displaces the most expensive generation sources first, predominately yet-to-be-built fossil fuel (such as natural gas) capacity and existing natural gas generators that provide power during times of peak demand.
By 2050, we project that coal-fired generation will be 11%, or 66 BkWh, lower in the Corporate Goal case than in the Reference case. Coal-fired generation in 2050 will be 511 BkWh in the Corporate Goal case, compared with 589 BkWh in the Reference case. Coal-fired generation that retires in the Corporate Goal case, either planned or modeled, generally represents generating units that are operating uneconomically or will become uneconomical over the projection period. More-efficient coal-fired generating units that operate during more hours of the year, paired with a larger nuclear fleet, provide a lower-cost alternative to retiring coal-fired generation and nuclear fleets in the Corporate Goal case, replacing them with new renewables and natural gas-fired generating units.
Projected levels of nuclear generation differ between the Reference case and the Corporate Goal case (Figure 2). This difference is primarily the result of nuclear plants that would otherwise retire for economic reasons in the Reference case but do not retire in the Corporate Goal case. In the Corporate Goal case, nuclear generation flattens out after 2025, when the last planned nuclear unit retirement reported to us occurs. In the Corporate Goal case, the nuclear plants that would otherwise be retired by the model in the Reference case continue to operate because they contribute to the carbon-free generation goals of the corporate entities. No new nuclear plants are added in either case. Small increases in nuclear generation in the later years result from modeled uprates for the remaining nuclear fleet, which slightly increase the overall capacity of each remaining plant.

Wind generation in the Corporate Goal case changes only slightly relative to the Reference case until 2035, when wind generation increases to 6.4% more than in the Reference case (Figure 2) by 2050. Similarly, photovoltaic solar generation remains unchanged relative to the Reference case until 2040. After 2040, utility-scale solar generation increases 12.7% more than in the Reference case by 2050.
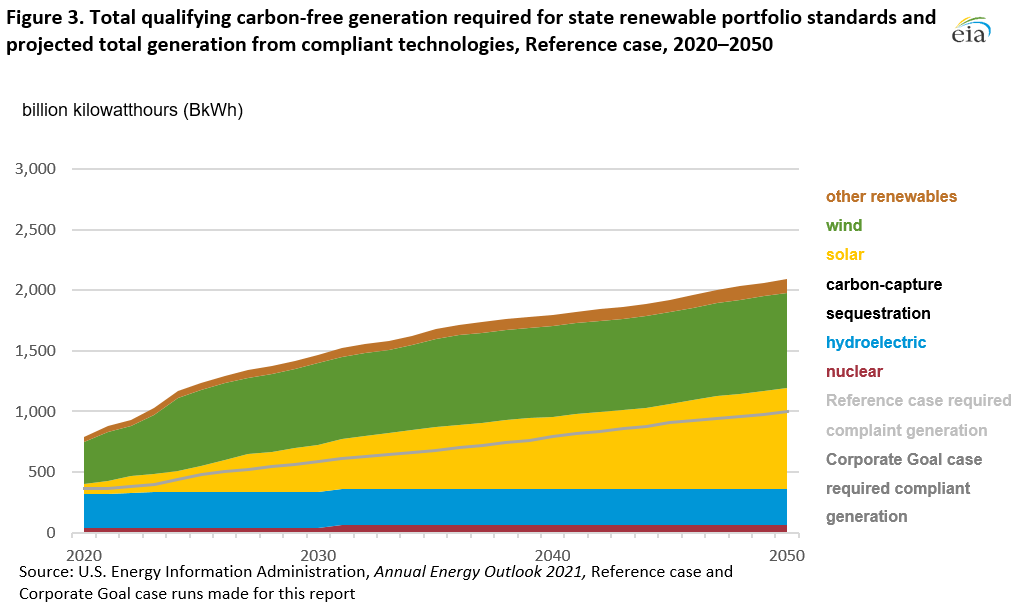
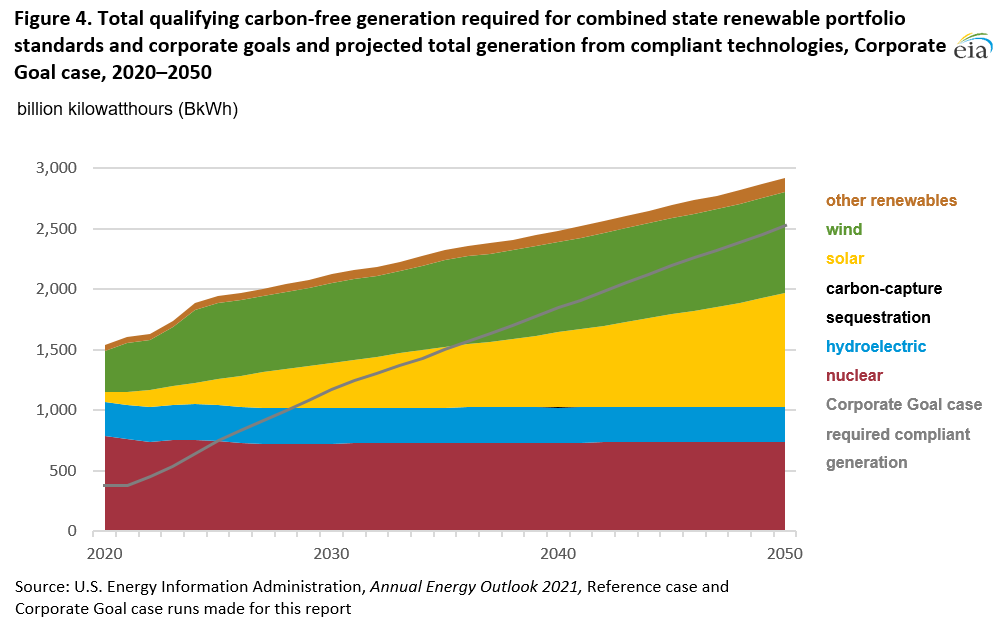
In the Reference case, RPS-eligible generation exceeds the total renewable generation requirement through 2050, suggesting that renewables are largely built, not strictly to meet compliance, but because they are the most cost-effective technology to meet generation needs (Figure 3). Adding corporate goals to the state RPS requirements increases the total amount of zero-carbon generation available to ensure compliance with all policies. However, most state RPS policies do not include nuclear generation, but most corporate goals do allow nuclear generation to count toward carbon-free generation. Even with the higher target for carbon-free generation in the Corporate Goal case, the excess generation from compliant technologies still exceeds the total required generation for both state RPS and corporate carbon reduction goals in the early years. However, by 2050, the projected compliant generation and required generation are almost the same; compliant generation exceeds required generation by 390 BkWh.
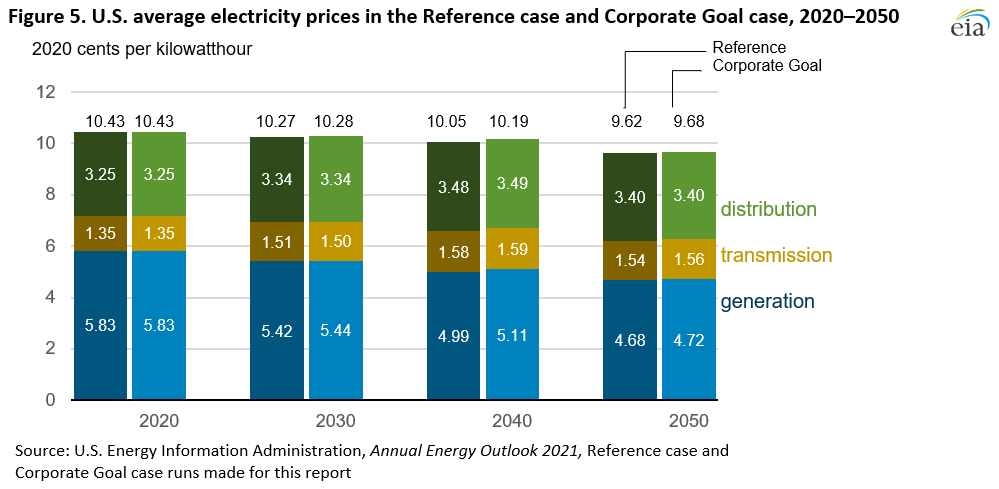
Electricity prices
The average electricity price for all sectors declines over time in both cases although the resulting electricity price is $0.06/kWh higher in the Corporate Goal case in 2050 compared with the Reference case. Overall, the generation component of electricity prices falls in the later years as a result of the increasing penetration of renewables in both cases. Transmission prices increase after 2020, but they fluctuate slightly through the remainder of the projection period. Distribution costs also increase after 2020, but they fluctuate throughout the projection period.
Natural gas
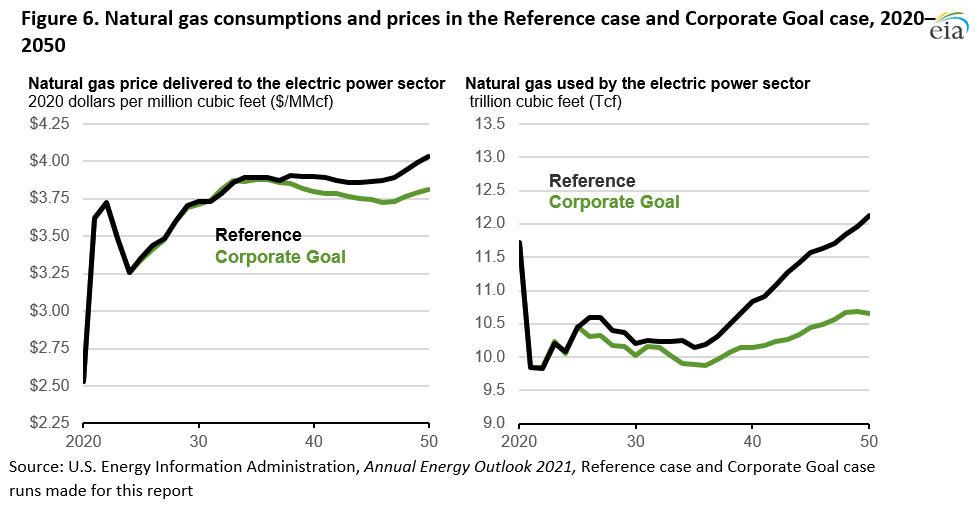
Natural gas consumed by the electric power sector differs between the two cases (Figure 5). Utilities rely on renewables and nuclear to meet their carbon reduction goals in the Corporate Goal case, and they use less natural gas to meet electricity demand than in the Reference case. This shift results in 12.1% less natural gas consumed by the electric power sector in most years of the projection period in the Corporate Goal case compared with the Reference case. As a consequence, natural gas prices decline, and the price of natural gas delivered to the electricity sector is 5.4% per million British thermal unit (MMBtu) lower in the Corporate Goal case compared with the Reference case. Despite decreases in natural gas consumption in the electric power sector in the Corporate Goal case, overall U.S. production of natural gas declines 2.9% because of consistent consumption in the industrial sector and export demand attributed to lower prices. This slight decrease results in the average delivered price for natural gas across all sectors to decline by 1.5% per MMBtu.
Electricity-related CO2 emissions
In 2050, CO2 emissions from the electric power sector in the Corporate Goal case are 11.6% lower than in the Reference case because additional carbon-neutral generation resources contribute to a higher share of generation. U.S electricity-related CO2 emissions across both cases diverge beginning in 2025. Before 2025, electricity-related CO2 emissions decline in both cases as a result of similar levels of planned retirements of coal-fired generating units. Across both cases, starting in 2025, factors such as continued low natural gas prices (compared with historical prices) and compliance with the Affordable Clean Energy Rule (ACE Rule) drive the retirement of coal-fired generating units.5 After 2025, when the ACE Rule takes full effect across both cases, the remaining coal-fired generating plants operate at higher utilization rates following the retirement of older, less efficient coal plants, leaving only the more efficient plants in operation in both cases. After 2025, higher projected generation from natural gas in the Reference case than in the Corporate Goal case results in slightly higher electricity-related CO2 emissions in the Reference case when compared with the Corporate Goal case.
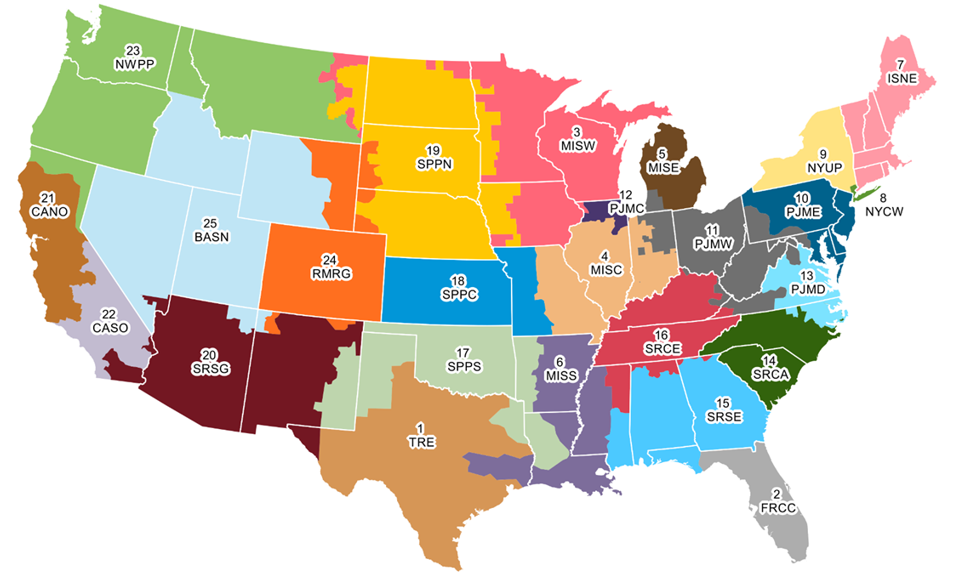
Regional case studies
On a national level, including corporate carbon-reduction goals in the model does not drastically alter the generation mix. However, regionally, the generation mix can vary widely depending on case assumptions.
We chose to model two regions that do not have existing high-target RPS in the Reference case but realize more aggressive carbon reduction goals in the Corporate Goal case:
- Midcontinent Independent System Operator Central (MISC), or Middle Mississippi Valley,6 includes parts of Missouri, Illinois, and Indiana
- SERC Reliability Corporation (SERC) East (SRCA), or Carolinas, includes part of North Carolina and all of South Carolina
Appendix 2 provides a map of all of the NEMS Electricity Market Module (EMM) regions.
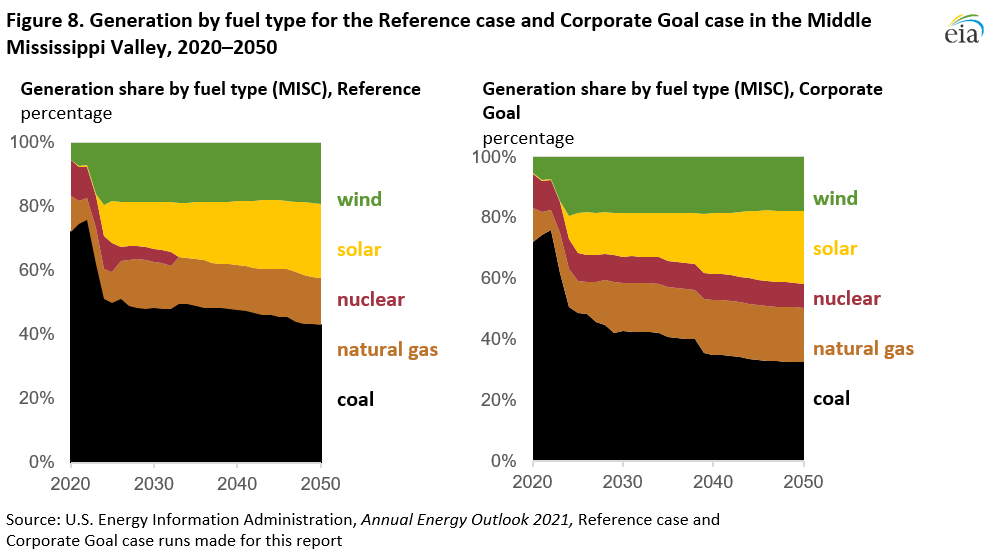
Midcontinent Independent System Operator Central (MISC), Middle Mississippi Valley
The Middle Mississippi Valley region includes parts of Missouri, Illinois, and Indiana. In the Reference case, Missouri’s RPS is 15% renewable generation by 2021, and Illinois’ RPS is 25% renewable generation by 2026. Indiana has no RPS in the Reference case.7 When we consider corporate goals, the RPS-equivalent clean energy standards for these states noticeably increase to 58% by 2050 for Missouri, to 31% by 2040 for Illinois, and to 69% by 2050 for Indiana.8
For the generation mix in the MISC region, the most prevalent difference between the two cases is the level of nuclear generation through the projection period in the Corporate Goal case (Figure 7). Although wind and solar generation combined begin the projection period in both cases making up less than 10% of the total, by 2050 the combined generation share of wind and solar is about 42% in both cases. Pursuing a carbon reduction goal has essentially no effect on renewable generation. Continued operation of existing nuclear generators and additional natural gas capacity causes additional coal capacity to retire in the Corporate Goal case. These retirements reduce the share of coal generation from 43% in 2050 in the Reference case to 33% in 2050 in the Corporate Goal case.
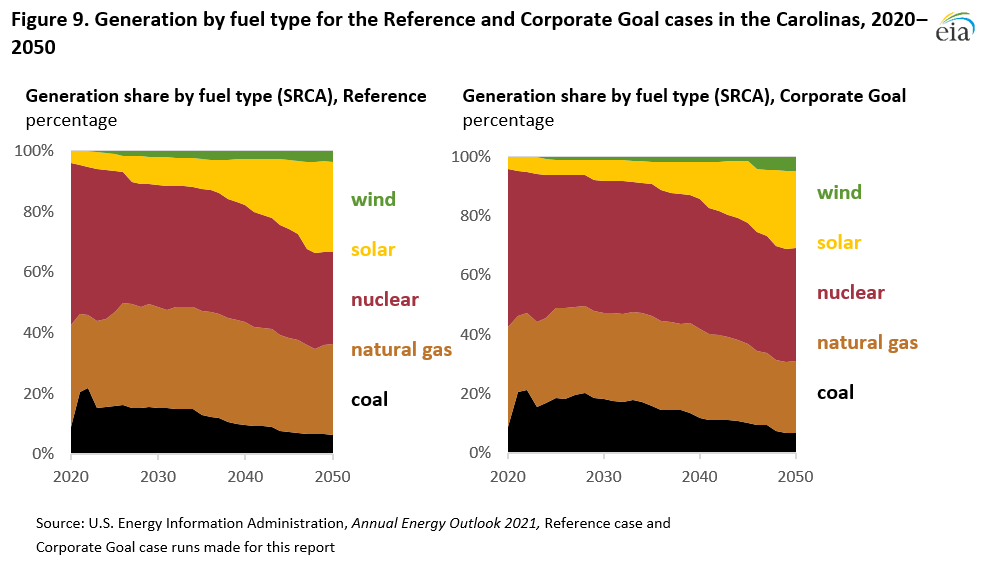
SERC Reliability Corporation East Carolinas (SRCA)
In NEMS, most of North Carolina and all of South Carolina make up the Carolinas region. In the Reference case, North Carolina has a pre-existing RPS of 12.5% renewable generation by 2021, and South Carolina has no RPS. The RPS-equivalent corporate carbon reduction goals are 35% by 2050 for North Carolina and 48% by 2050 for South Carolina.
The Corporate Goal case has 2.5 GW of additional nuclear capacity than in the Reference case, leaving natural gas generation and solar generation with smaller shares throughout the projection period than in the Reference case. Nuclear generators that would otherwise retire in the Reference case continue to operate in the Corporate Goal case, reducing the need for new capacity, which is economically provided by solar and natural gas in the Reference case. Nuclear is among the largest forms of generation in the region; it has approximately 10 GW of capacity by 2050 in the Reference case and 12 GW of capacity throughout the projection period for the Corporate Goal case. Nuclear accounts for the second-largest share of generation behind natural gas by 2030 in both cases, ranging from 53% of generation in 2020 to 31% in 2050 in the Reference case and from 53% of generation in 2020 to 37% in 2050 in the Corporate Goal case.
Appendix 1. Renewable Portfolio Standards (RPS) Requirements and Effective RPS in the Reference and the Corporate Goal Cases
| State1 | Reference case target2 | Effective RPS for Corporate Goal case3 |
|---|---|---|
| States with existing renewable portfolio standards | ||
| Arizona | 15% renewable by 2025 | 44.71% carbon-neutral by 2050 |
| California | 60% renewable by 2030, 100% carbon-free by 2045 | Maintains Reference case path |
| Colorado | 30% renewable by 2020 for investor-owned utilities, 20% by 2020 for large electric cooperatives, and 10% by 2020 for other cooperatives and municipal utilities serving more than 40,000 customers | 54% carbon-neutral by 2050 |
| Connecticut | 48% by 2030 (44% renewable, 4% efficiency and combined heat and power) | 50.89% carbon-neutral by 2050 |
| Delaware | 25% renewable by 2026 | Maintains Reference case path |
| District of Columbia | 100% renewable by 2040 | Maintains Reference case path |
| Illinois | 25% renewable by 2026 (3,000 megawatts [MW] solar and 1,300 MW wind) | 30.9% carbon-neutral by 2050 |
| Iowa | 105 MW of eligible renewable resources | 27.78% carbon-neutral by 2050 |
| Massachusetts | 35% renewable by 2030 (and an additional 1% per year thereafter) | Maintains Reference case path |
| Maryland | 50% renewable by 2030 | Maintains Reference case path |
| Maine | 100% carbon-neutral by 2050 | Maintains Reference case path |
| Michigan | 15% renewable by 2021 and specific new capacity goals for utilities that serve more than 1 million customers | 66.91% carbon-neutral by 2040 |
| Minnesota | 31.5% renewable by 2020 (Xcel), 26.5% renewable by 2025 (other investor-owned utilities), or 25% renewable by 2025 (other utilities) | 50.29% carbon-neutral by 2040 |
| Missouri | 15% renewable by 2021 | 57.51% carbon-neutral by 2040 |
| Montana | 15% renewable by 2015 | 52.40% carbon-neutral by 2045 |
| North Carolina | 12.5% renewable by 2021 for investor-owned utilities and 10% renewable by 2018 for municipal and cooperative utilities | 35.32% carbon-neutral by 2050 |
| New Hampshire | 24.8% renewable by 2025 | Maintains Reference case path |
| New Jersey | 50% renewable by 2030. The solar carve-out reaches 5.1% in 2021 before gradually decreasing to 1.1% by 2033 | Maintains Reference case path |
| New Mexico | 80% renewable by 2040 and 100% carbon-free by 2045 | Maintains Reference case path |
| Nevada | 50% renewable by 2030 and 100% carbon-free by 2050 | Maintains Reference case path |
| New York | 70% renewable by 2030 and 100% carbon-free by 2040. | Maintains Reference case path |
| Ohio | 8.5% renewable by 2026 | 45.68% carbon-neutral by 2050 |
| Oregon | 50% renewable by 2040 | 51.24% carbon-neutral by 2050 |
| Pennsylvania | 18% renewable by 2020 | 30.73% carbon-neutral by 2050 |
| Rhode Island | 38.5% renewable by 2035 | 68.10% carbon-neutral by 2050 |
| Texas | 5,880 MW renewable by 2015 | 7.16% carbon-neutral by 2050 |
| Vermont | 75% renewable by 2032 | 76.06% carbon-neutral by 2030 |
| Virginia | 100% carbon-neutral by 2050 | Maintains Reference case path |
| Washington | 100% carbon-free by 2045 | Maintains Reference case path |
| Wisconsin | 10% renewable by 2015 | 68.87% carbon-neutral by 2050 |
| States with no existing renewable portfolio standards4 | ||
| Alabama | 61.47% carbon-neutral by 2050 | |
| Arkansas | 22.68% carbon-neutral by 2030 | |
| Florida | 26.38% carbon-neutral by 2050 | |
| Georgia | 57.76% carbon-neutral by 2050 | |
| Idaho | 42.89% carbon-neutral by 2045 | |
| Indiana | 69.35% carbon-neutral by 2050 | |
| Kansas | 50.65% carbon-neutral by 2050 | |
| Kentucky | 38.80% carbon-neutral by 2050 | |
| Louisiana | 38.80% carbon-neutral by 2050 | |
| Mississippi | 33.15% carbon-neutral by 2050 | |
| North Dakota | 10.27% carbon-neutral by 2050 | |
| Oklahoma | 46.89% carbon-neutral by 2050 | |
| South Carolina | 48.46% carbon-neutral by 2050 | |
| South Dakota | 26.83% carbon-neutral by 2050 | |
| Tennesee5 | 1.36% carbon-neutral by 2030 | |
| Utah | 47.18% carbon-neutral by 2030 | |
| WestVirginia | 70.43% carbon-neutral by 2050 | |
| Wyoming | 41.49% carbon-neutral by 2045 | |
1 Although Hawaii has a renewable portfolio standard for 100% renewable generation by 2045, which we implicitly accounted for in previous work, we did not include generation in Alaska and Hawaii in this analysis because the generation mix from these states is determined outside of the NEMS because of the unique electricity supply markets in these states. |
||
Appendix 2. Electricity Market Module Regions