U.S. Energy Information Administration logo
Skip to sub-navigation
March 2, 2021

Annual U.S. natural gas production decreased by 1% in 2020
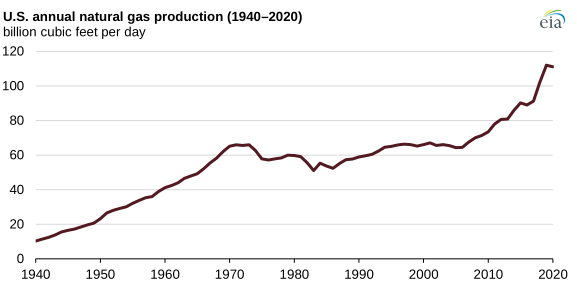
U.S. annual natural gas production
Source: U.S. Energy Information Administration, Monthly Crude Oil and Natural Gas Production Report, Natural Gas Monthly
Note: Natural gas production is measured as gross withdrawals.

U.S. natural gas production—as measured by gross withdrawals—averaged 111.2 billion cubic feet per day (Bcf/d) in 2020, down 0.9 billion Bcf/d from 2019 as result of a decline in drilling activity related to low natural gas and oil prices in 2020.

The 2019 record-high increase in natural gas production led to higher volumes of natural gas in storage and lower natural gas prices. Beginning in March 2020, warmer-than-average weather along with the effects of the responses to COVID-19 drove down natural gas demand and further reduced prices. The lowest average monthly U.S. natural gas production volume was in May 2020 at 106.4 Bcf/d. By December 2020, natural gas production had increased to 113.0 Bcf/d.

The Appalachia region remains the largest natural-gas producing region in the United States. Natural gas production from the Marcellus and Utica/Point Pleasant shales of Ohio, West Virginia, and Pennsylvania continued to grow despite low regional natural gas spot prices. Natural gas production from these three states increased from 32.1 Bcf/d in 2019 to 33.6 Bcf/d in 2020. Within the Appalachia region, West Virginia had the largest increase in natural gas production, increasing by 1.2 Bcf/d, or 20%, to reach 7.1 Bcf/d. Natural gas production increased by 1.0 Bcf/d in Pennsylvania and decreased by 0.7 Bcf/d in Ohio.
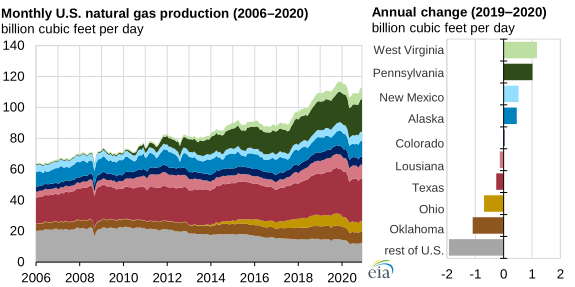
monthly U.S> natural gas production
Source: U.S. Energy Information Administration, Monthly Crude Oil and Natural Gas Production Report
Note: Natural gas production is measured as gross withdrawals.

In 2020, Oklahoma had the largest decrease in natural gas production, falling by 1.1 Bcf/d, or 13%, to an annual average of 7.6 Bcf/d. Texas remained the largest natural-gas producing state, although natural gas production in the state decreased from 28.4 Bcf/d in 2019 to 28.1 Bcf/d in 2020.

Principal contributor: Emily Geary

Statistics
Analysis
Tools
Education
News

Petroleum & Other Liquids

Crude oil, gasoline, heating oil, diesel, propane, and other liquids including biofuels and natural gas liquids.

Natural Gas

Exploration and reserves, storage, imports and exports, production, prices, sales.

Electricity

Sales, revenue and prices, power plants, fuel use, stocks, generation, trade, demand & emissions.

Coal

Reserves, production, prices, employment and productivity, distribution, stocks, imports and exports.

Nuclear & Uranium

Uranium fuel, nuclear reactors, generation, spent fuel.

Renewable & Alternative Fuels

Includes hydropower, solar, wind, geothermal, biomass and ethanol.

EIA Survey Forms

Forms EIA uses to collect energy data including descriptions, links to survey instructions, and additional information.

Total Energy

Comprehensive data summaries, comparisons, analysis, and projections integrated across all energy sources.

U.S. States

State energy information, including overviews, rankings, data, and analyses.

International

International energy information, including overviews, rankings, data, and analyses.

Environment

Greenhouse gas data, voluntary reporting, electric power plant emissions.

Data Tools, Apps, & Maps

Tools to customize searches, view specific data sets, study detailed documentation, and access time-series data.

Open Data

EIA's free and open data available as API, Excel add-in, bulk files, and widgets

EIA Beta

Come test out some of the products still in development and let us know what you think!

Open Source Code

EIA's open source code, available on GitHub.

RSS Feeds

Subscribe to feeds for updates on EIA products including Today in Energy and What's New.