U.S. Energy Information Administration logo
Skip to sub-navigation

Petroleum & Other Liquids

Monthly Crude Oil and Natural Gas Production

With Data through December 2023   |    Release Date: February 29, 2024   |    Next Release Date: March 29, 2024  


Crude Oil (thousand barrels per day)
State/area Percent change Percent change

Notes: Crude oil includes lease condensate. The sum of individual states may not equal total U.S. volumes due to independent rounding. Volumes are rounded to the nearest whole number; a zero may indicate volume of less than 0.5 thousand barrels per day. Previous months' production volumes may have been revised for all states/areas. Percent change is calculated using unrounded values.
Sources: Data for Arkansas, California, Colorado, Federal Offshore Gulf of Mexico, Kansas, Louisiana, Montana, New Mexico, North Dakota, Ohio, Oklahoma, Pennsylvania, Texas, Utah, West Virginia, and Wyoming are estimated from data collected on the EIA-914 report. Data for states/areas not individually reported on the EIA-914 (Alabama, Alaska, Arizona, Federal Offshore Pacific, Florida, Idaho, Illinois, Indiana, Kentucky, Michigan, Mississippi, Missouri, Nebraska, Nevada, New York, South Dakota, Tennessee, and Virginia) are from EIA estimates published in the Petroleum Supply Annual and Petroleum Supply Monthly reports, based on crude oil production data from state government agencies and the U.S. Department of the Interior, Bureau of Safety and Environmental Enforcement (and predecessor agencies), Enverus, IHS Markit, and first purchase data reported on Form EIA-182, Domestic Crude Oil First Purchase Report.

Natural Gas (million cubic feet per day)
State/area Percent change Percent change

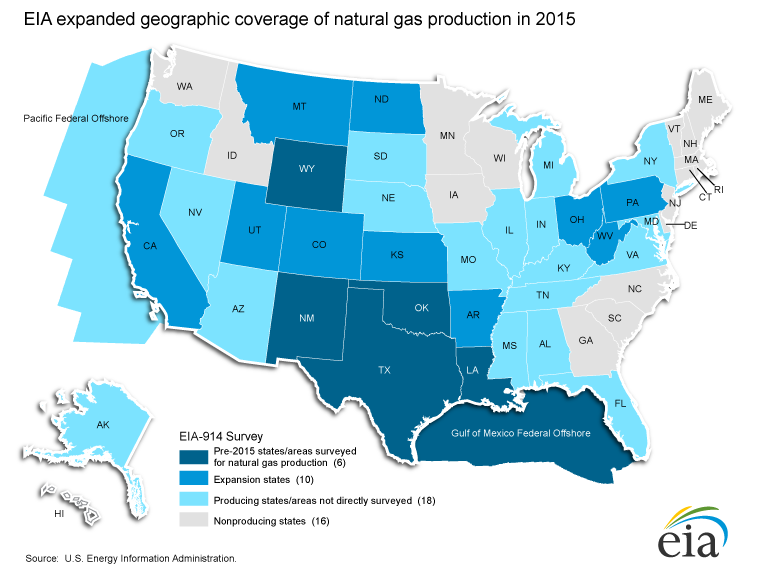
Notes: Natural gas production represents monthly natural gas gross withdrawals estimated from data collected on the EIA-914 report. Data for Arkansas, California, Colorado, Kansas, Louisiana, Montana, New Mexico, North Dakota, Ohio, Oklahoma, Pennsylvania, Texas, Utah, West Virginia, Wyoming, and Federal Offshore Gulf of Mexico are individually collected on the EIA-914 report. The "Other States" category comprises states/areas not individually collected on the EIA-914 report. Through 2022, "Other States" includes Alabama, Arizona, Florida, Idaho, Illinois, Indiana, Kentucky, Maryland, Michigan, Mississippi, Missouri, Nebraska, Nevada, New York, Oregon, South Dakota, Tennessee, and Virginia. Federal Offshore Pacific is included in California through 2022, and in "Other States" starting in 2023.
Sources: Form EIA-914, Monthly Crude Oil and Lease Condensate, and Natural Gas Production Report and its predecessor, Monthly Natural Gas Production Report; BSEE reports; PointLogic Energy; Enverus; IHS Markit; industry reports; and EIA computations.

Additional data and methodology

Table 1. Crude oil and lease condensate production in the United States    

Table 2. Crude oil and lease condensate production in the United States with monthly and annual changes    

Table 3. Natural gas gross withdrawals in selected states and the Federal Gulf of Mexico    

Table 4. Natural gas gross withdrawals in selected states and the Federal Gulf of Mexico with monthly and annual changes    

Table 5. Crude oil and lease condensate production by API gravity category in selected Lower 48 states and the Federal Gulf of Mexico    

  • Comparisons and statistical measures
  • Crude oil comparisons with other estimates
  • Natural gas comparisons with other estimates
  • Historical oil production by API gravity
  • Methodology
  • Revision Policy

  • map of 914 states gas surveyed

    Frequently Asked Questions