
In 2020, U.S. natural gas prices were the lowest in decades
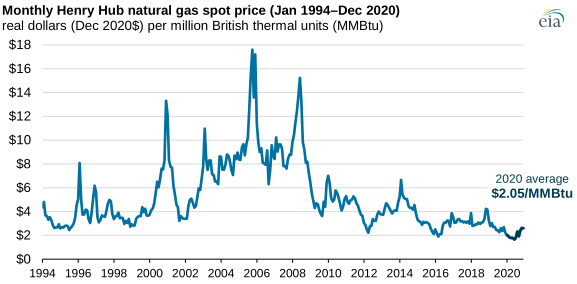
In 2020, natural gas spot prices at the national benchmark Henry Hub in Louisiana averaged $2.05 per million British thermal units (MMBtu), the lowest annual average price in decades. Prices started the year relatively low because mild winter weather led to less natural gas demand for space heating. Prices remained low as economic effects induced by the COVID-19 pandemic reduced both natural gas production and consumption.
Beginning in March, spring weather and responses to COVID-19 drove down natural gas demand, further lowering prices. The Henry Hub price averaged $1.66/MMBtu in June, the lowest monthly price in decades. Prices increased in the second half of the year because of lower natural gas production and an increase in liquefied natural gas (LNG) exports.
Consumption of natural gas in the United States decreased among residential, commercial, and industrial users. In contrast, natural gas use for electric power generation rose, based on the U.S. Energy Information Administration’s (EIA) monthly data through October 2020 and estimates for November and December.
Natural gas consumed to generate electric power in the United States reached a record high, averaging 31.6 billion cubic feet per day (Bcf/d) in 2020, or 2% more than the 2019 average. This increase occurred despite slightly lower total U.S. electricity consumption this year. Natural gas consumed by electric power plants set a daily record high of 47.2 Bcf at the end of July, according to S&P Global Platts estimates, because of record-high summer temperatures and low summer prices.
Production of dry natural gas averaged 90.9 Bcf/d in the United States during 2020, or 2.2 Bcf/d less than in 2019, after reaching a monthly record high of 97.0 Bcf/d in December 2019. The production decline reversed a three-year trend of consistent growth in U.S. natural gas production. The number of rigs drilling for natural gas began declining in the United States during the spring, reaching a record low of 68 natural gas-directed rigs in July. The rig count stayed relatively low throughout the rest of 2020.
In the summer of 2020, U.S. exports of LNG were affected by hurricanes and by changes in demand for natural gas in Europe and Asia, but exports increased in the final months of the year. EIA estimates that the United States exported 9.4 Bcf/d of LNG in November 2020, a volume equivalent to 10% of U.S. dry natural gas production in that month.
Principal contributor: Kristen Tsai
Tags: prices, natural gas