CO2 emissions from coal fell by record amount in 2015, led by Texas and Midwest
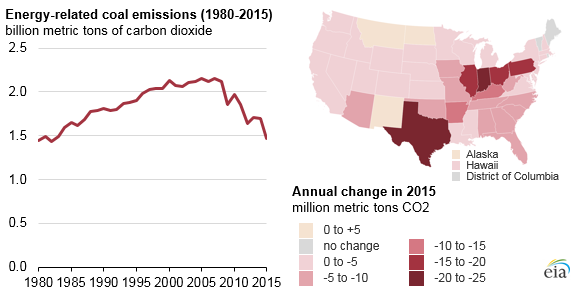
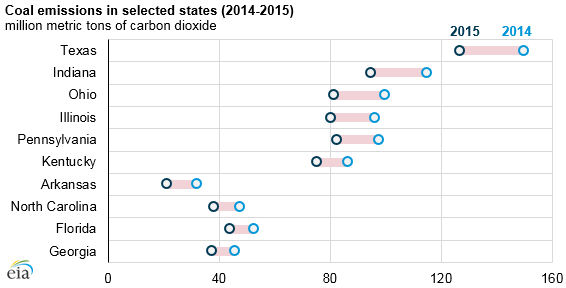
Carbon dioxide (CO2) emissions associated with coal consumption in the United States fell by a record 231 million metric tons in 2015. More than 60% of the annual decrease occurred in 10 states, led by Texas, Indiana, Ohio, Illinois, and Pennsylvania, according to EIA’s state-level carbon dioxide emissions data. Most of the decline in 2015 U.S. coal consumption occurred in the electric power sector, where reduced coal-fired electricity generation was largely offset by higher natural gas-fired electricity generation.
Note: Click to enlarge.
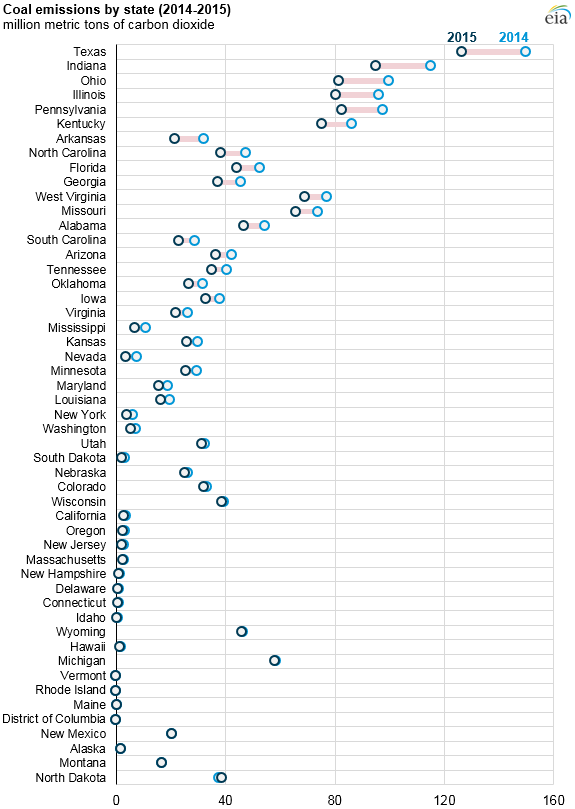
In 2015, a decline in coal emissions occurred in nearly every state. CO2 emissions from coal only increased in four states during 2015; another three states and the District of Columbia produced zero or nearly zero coal emissions (less than 50,000 metric tons) in both 2014 and 2015. Total energy-related CO2 emissions fell in 2016 and are projected to fall in 2017 and rise in 2018, based on EIA’s latest Short-Term Energy Outlook projection.
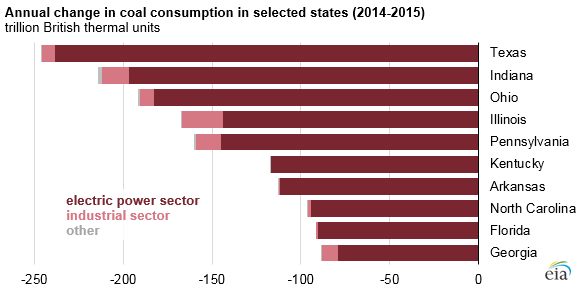
In the United States, about 90% of coal is consumed in the electric power sector. Among the top 10 states with the largest coal emissions reductions in 2015, the electric power sector’s share of coal consumption ranged from 98% in Texas to 76% in Pennsylvania, based on data from EIA’s State Energy Data System. In 2015, Illinois had the largest decline in industrial coal consumption, followed by Alabama and Indiana.
Changes in the electric power sector accounted for most of the decline in coal emissions in 2015. Power plant operators reduced generation from existing coal-fired units in response to competition from lower-priced natural gas. In addition, nearly 15 gigawatts (GW) of coal-fired electric generating capacity were retired in 2015, or about two-thirds of all retired capacity that year, based on data in EIA’s annual survey of electric generators. Many of those retirement decisions were likely affected by compliance deadlines associated with the Environmental Protection Agency’s Mercury and Air Toxics Standards rule, which had an initial compliance date of April 2015.
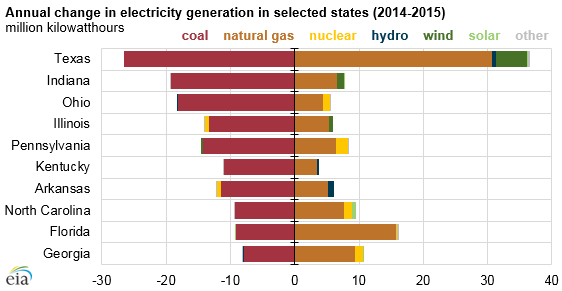
Most of the 2015 decrease in coal-fired electricity generation was replaced with increases in natural gas-fired generation. For the entire United States in 2015, coal-fired generation fell 15%, by 228 billion kilowatthours, and natural gas increased 20%, by 204 billion kilowatthours, relative to the previous year. The natural gas fleet was being used more often, and the utilization rate of natural gas combined-cycle generators exceeded that of coal generators for the first time in 2015.
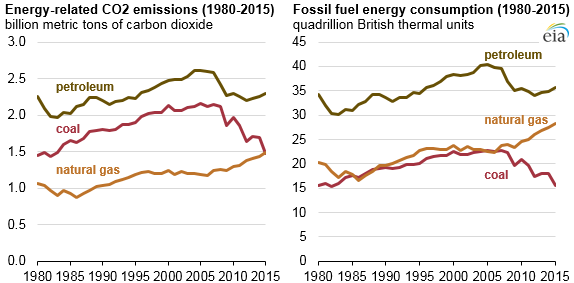
Although natural gas generation increased, the CO2 emissions associated with that natural gas consumption were not enough to offset the decrease in coal-related CO2 emissions in 2015. Coal-related CO2 emissions across all sectors decreased 231 million metric tons from 2014 levels, and natural gas-related CO2 emissions across all sectors increased 43 million metric tons.
Energy-related CO2 emissions from natural gas surpassed those from coal for the first time in 2015, totaling 1,482 million metric tons compared with coal’s 1,467 million metric tons. However, because natural gas is less carbon intensive than coal, about 80% more energy was provided by the natural gas (28.2 quadrillion British thermal units) consumed in 2015, compared with coal (15.5 quadrillion British thermal units).
Principal contributor: Owen Comstock
Tags: CO2 (carbon dioxide), coal, electricity, emissions, environment, generation, map, Midwest, natural gas, states, Texas