Average utilization for natural gas combined-cycle plants exceeded coal plants in 2015
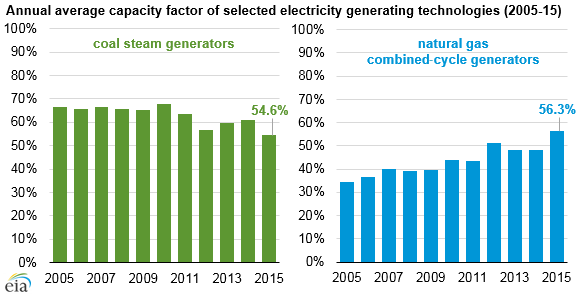
Last year marked the first time on record that the average capacity factor of natural gas combined-cycle plants exceeded that of coal steam plants. The power industry has been running natural gas combined-cycle generating units at much higher rates than just 10 years ago, while the utilization of the capacity at coal steam power plants has declined. The capacity factor of the U.S. natural gas combined-cycle fleet averaged 56% in 2015, compared with 55% for coal steam power plants.
The mix of energy sources used in U.S. electricity generation has changed dramatically over the past few years. This change is particularly evident in the shift from the use of coal to natural gas for power generation. The industry has been building new natural gas capacity and retiring coal plants, but another important factor behind the changing generation mix is the day-to-day pattern of how existing power plants are used.
Coal power plants primarily rely on steam-driven generating units. In contrast, power plants fueled by natural gas rely on a variety of technologies. Natural gas-fired generating units driven by combustion turbines or steam turbines accounted for about 28% and 17%, respectively, of total natural gas-fired capacity in 2015. Combined-cycle plants, which are designed as an efficient hybrid of the other two technologies, accounted for 53% of gas-fired generation capacity and tend to be used more often than the other types of natural gas generators, as measured by capacity factors.
Capacity factors describe how intensively a particular generating unit or a fleet of generators is run. For instance, a capacity factor near 100% means that the unit is operating almost all the time at a rate close to its maximum possible output.
When natural gas prices exceeded coal prices by a large margin, as was typically the case over the 2005-08 period, electricity systems where both natural gas-fired combined-cycle and coal-fired power plants were available to serve load would typically run combined-cycle units only after making maximum use of available coal-fired generation. As natural gas prices have declined, power plant operators have found it more economical to run combined-cycle units at higher levels.
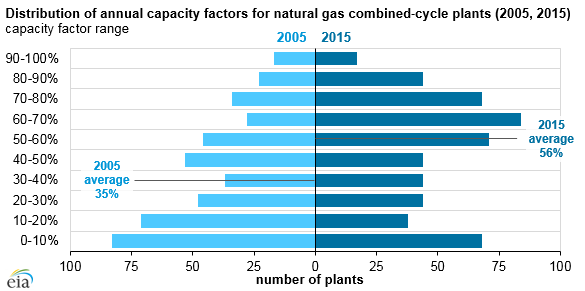
The capacity factor of the U.S. natural gas combined-cycle fleet has risen steadily from an average of 35% in 2005 to more than 56% in 2015. Although there is a wide variation of capacity factors for natural gas combined-cycle power plants, many of these units operated in the 50%-80% range in 2015. In 2005, combined-cycle units commonly operated at capacity factors lower than 30%.
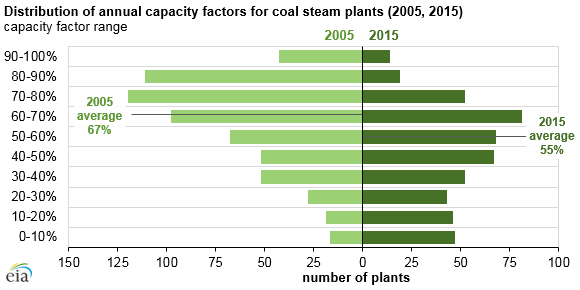
Coal steam power plants require more energy input per megawatthour of generation than natural gas-fired combined-cycle plants. Yet, the low cost of coal relative to natural gas until recent years favored the use of coal-fired generating units to fulfill baseload electricity demand, leading plant operators to run these units at rates close to their output capacity during peak demand hours. During off-peak hours, such as overnight, coal plants generally continued to operate. But, in areas with large amounts of available coal or nuclear generation capacity, many coal plants would run at rates closer to their minimum operable capacity.
Nearly half of all coal plants ran at capacity factors above 70% in 2005. Since 2012, coal plants have faced much more competition from natural gas combined-cycle units for supplying baseload demand. In 2015, less than one-fifth of all coal plants operated at capacity factors higher than 70%.
Principal contributor: Tyler Hodge