EIA electricity generator data show power industry response to EPA mercury limits
Note: SCR is selective catalytic reduction.
EIA recently released preliminary data from its annual survey of electric generators (EIA-860), which provides information on pollution control equipment at electric power plants. A significant number of electric power plants recently installed such equipment in response to the U.S. Environmental Protection Agency's (EPA) Mercury and Air Toxics Standards (MATS).
MATS establishes emissions limits for toxic air pollutants associated with coal combustion such as mercury, arsenic, and heavy metals. MATS requires all coal generators that sell power and have capacity greater than 25 megawatts (MW) to comply with specific emission limits by April 2015, although some units received extensions, as discussed below. Although hundreds of coal generators have capacities below 25 MW, those units collectively represent less than 1% of total coal capacity.
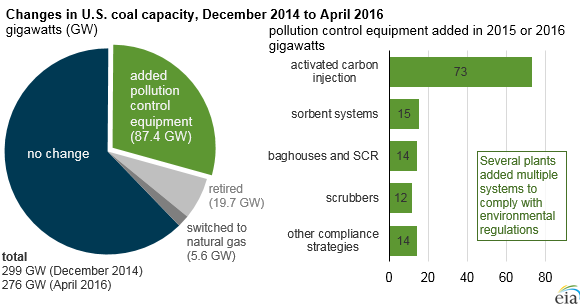
Coal-fired generating capacity in the United States dropped from 299 gigawatts (GW) at the end of 2014 to 276 GW as of April 2016. Coal-fired generation's share of total electricity generation fell from 39% in 2014 to 28% in the first four months of 2016. These changes can be attributed to a mix of competitive pressure from low natural gas prices and the costs and technical challenges of environmental compliance measures.
Between January 2015 and April 2016, about 87 GW of coal-fired plants installed pollution control equipment and nearly 20 GW of coal capacity retired. Twenty-six percent of those retirements occurred in April 2015, the MATS rule's initial compliance date. Most remaining coal plants applied for and received one-year extensions that allowed them to operate until April 2016 while developing compliance strategies. If a coal unit did not meet MATS requirements by then, it had to either retire, switch to another fuel, or cease operation. A few plants, totaling 2.3 GW, received additional one-year extensions, giving them until April 2017 to comply. About 5.6 GW of coal capacity fuel switched primarily to natural gas.
Of the 87 GW of coal capacity that installed pollution control equipment to comply with MATS, activated carbon injection (ACI) was the dominant compliance strategy. More than 73 GW of coal-fired capacity installed ACI systems in 2015 and 2016, effectively doubling the amount of coal capacity with ACI. As a capital investment, ACI systems are relatively modest, with an average cost of $5.8 million per generator over 2015 and 2016.
Other compliance strategies include the modification of existing emissions control equipment, the addition of new equipment or capabilities, or some combination of operational changes and new investments to improve mercury capture or to achieve other environmental control objectives, such as reducing emissions of particulate matter or nitrogen oxide. Many generators may have installed more than one type of equipment. Overall, operators invested at least $6.1 billion from 2014 to 2016 to comply with MATS or other environmental regulations.
Although EIA's data are preliminary, 98% of coal capacity status is reported to EIA on a monthly basis, meaning the uncertainty associated with the values presented here is relatively small. Full-year 2016 information will be reported to EIA in 2017 and made available later that year.
Principal contributors: Sara Hoff, Jonathan DeVilbiss
Tags: capacity, coal, emissions, generation, standards