In 2021, both U.S. natural gas production and exports set new records
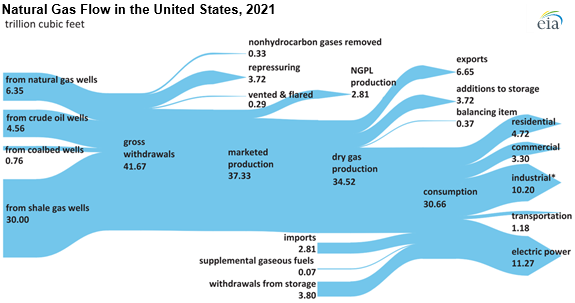
Note: Full U.S. natural gas flow diagram
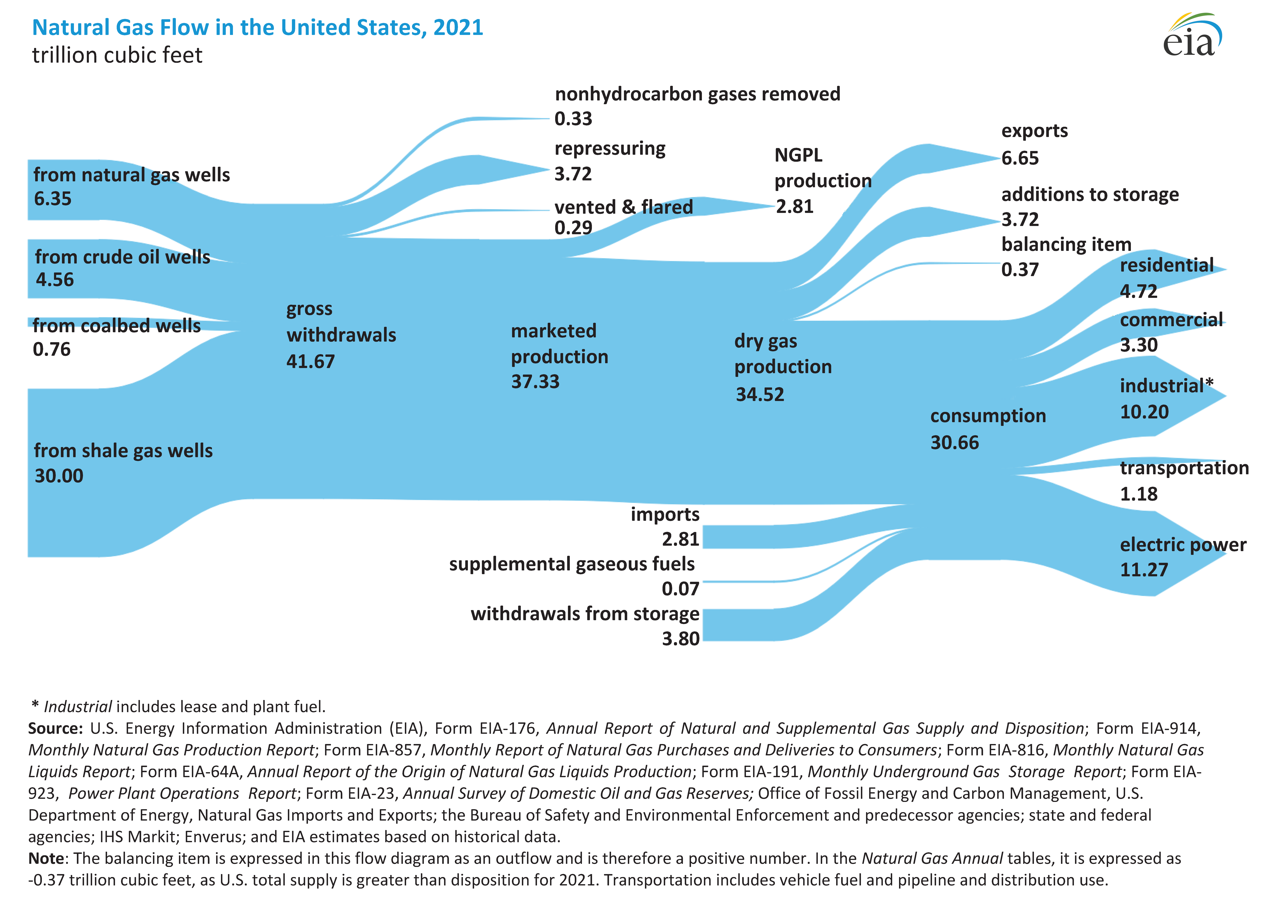
In 2021, both U.S. natural gas marketed production and natural gas exports established new records. Marketed, or wet, natural gas production—which includes both dry natural gas and natural gas plant liquids (NGPLs) such as ethane and propane—grew 3% in 2021 after declining in 2020. U.S. natural gas exports, which have more than doubled since 2017, increased 26% in 2021. The U.S. natural gas flow diagram from our Natural Gas Annual report shows the annual volume of U.S. natural gas supply (production, imports, and withdrawals from storage) and disposition (consumption, exports, and additions to storage) in 2021.

Note: NGPL = natural gas plant liquids
Natural gas production in the United States has generally increased over the past decade because of the widespread adoption of horizontal drilling and hydraulic fracturing techniques that allow operators to increase the efficiency of natural gas production from shale formations. In 2021, natural gas from shale formations accounted for 79% of all U.S. natural gas production. The increase in dry natural gas production was accompanied by an almost 4% increase in NGPL production in 2021, which has grown every year since 2005, averaging just under 8 billion cubic feet per day in 2021. The expansion of infrastructure needed to process growing volumes of marketed natural gas has resulted in more recovered NGPLs, leading to both greater domestic consumption and increased export volumes of ethane and propane.

U.S. natural gas exports have grown substantially over the past decade. In 2017, U.S. natural gas exports surpassed imports for the first time since 1957. Major growth in natural gas exports in the second half of the decade was driven by growth in liquefied natural gas (LNG), which the United States began shipping overseas in 2016 from the Lower 48 states. In 2021, LNG exports grew to 54% of total U.S. natural gas exports, up from 45% in 2020. Almost all other U.S. natural gas exports were by pipeline to Canada and Mexico.
So far in 2022, both natural gas marketed production and natural gas exports have continued to grow. In our Short-Term Energy Outlook, we forecast both marketed production and exports will continue to grow to record-high levels in 2023.
Principal contributors: Max Ober, Brett Marohl