
U.S. ethane exports surge with additional export capacity and expanded tanker fleet
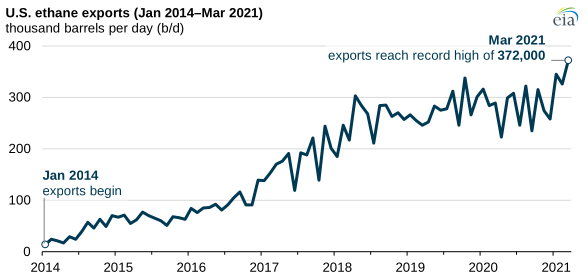
U.S. ethane exports reached an all-time high in March 2021 after a new export facility started operations and the tanker fleet that carries liquefied ethane overseas expanded.
Ethane exports surpassed 370,000 barrels per day (b/d) in March, including more than 280,000 b/d of waterborne exports. We expect growth in U.S. ethane exports to accelerate this year and next from an annual average of 281,000 b/d in 2020 to annual averages of 374,000 b/d in 2021 and 447,000 b/d in 2022, according to our June Short-Term Energy Outlook.
U.S. exports of ethane began in 2014. The first U.S. export pipelines for ethane were completed in 2014 to transport ethane to petrochemical plants in Canada. U.S. waterborne ethane exports began in 2016, when two waterborne export terminals (one in Marcus Hook, Pennsylvania, and one in Morgan’s Point, Texas) began operations. Capacity at the waterborne export terminals expanded from 275,000 b/d in 2016 to 305,000 b/d in 2019. In January 2021, a third export terminal began operations at Nederland, Texas, which increased U.S. capacity for waterborne exports by more than 170,000 b/d.
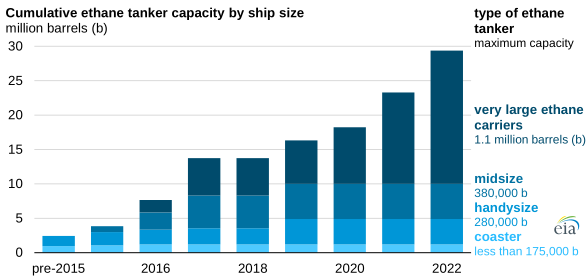
In addition to new export capacity, the capacity to ship ethane has also grown rapidly. Specially built tankers carry ethane that is cryogenically cooled to -128°F so it can be transported as a liquid. The tankers range from coasters that carry ethane or ethylene over short distances to very large ethane carriers (VLECs) designed to carry up to 1 million barrels on intercontinental routes. Until late 2020, eight VLECs were operating, all serving U.S. terminals. Near the end of 2020 and beginning of 2021, six new VLECs entered service, and another six VLECs are expected to be delivered and begin shipping ethane near the end of 2021.
Exports account for an increasing share of total U.S. ethane demand. In 2020, the United States exported about 16% of domestic ethane production, which rose from none in 2013. By 2018, the United States exported to six countries that had infrastructure to import cryogenically cooled ethane at coastal terminals connected to ethylene crackers. Now eight countries—Canada, China, India, the United Kingdom, Norway, Sweden, Mexico, and Brazil—can accept U.S. ethane exports.
Ethane is used primarily as a petrochemical feedstock, which means it is fed into ethylene crackers and heated to temperatures between 1,450°F to 1,600°F to break the ethane molecule down into ethylene. Ethylene is further processed to create derivatives such as polyvinyl chloride (PVC) and ethylene glycol (EG), but the most common process is polymerization to make polyethylene (PE), a common base component of plastics.
Principal contributors: Josh Eiermann, Warren Wilczewski
Tags: exports/imports, ethane, capacity