|
Download Data (XLS File) |
|
||||||||
|
||||||||
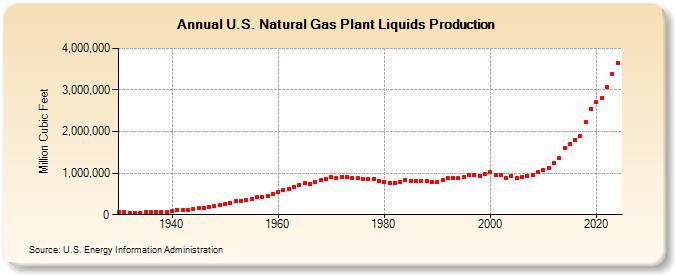
| U.S. Natural Gas Plant Liquids Production (Million Cubic Feet) | ||||||||
| Decade | Year-0 | Year-1 | Year-2 | Year-3 | Year-4 | Year-5 | Year-6 | Year-7 | Year-8 | Year-9 |
|---|---|---|---|---|---|---|---|---|---|---|
| 1930's | 75,140 | 62,288 | 51,816 | 48,280 | 52,190 | 55,488 | 61,064 | 70,210 | 73,338 | 73,746 |
| 1940's | 79,526 | 115,464 | 119,000 | 121,788 | 142,868 | 159,936 | 165,274 | 188,734 | 209,508 | 224,332 |
| 1950's | 259,862 | 292,400 | 319,158 | 340,068 | 354,348 | 376,686 | 418,013 | 433,636 | 458,040 | 498,457 |
| 1960's | 542,890 | 592,446 | 623,616 | 670,251 | 722,565 | 753,473 | 739,308 | 784,534 | 827,877 | 866,560 |
| 1970's | 906,413 | 883,127 | 907,993 | 916,551 | 887,490 | 872,282 | 854,086 | 862,563 | 852,130 | 807,845 |
| 1980's | 776,605 | 774,562 | 761,944 | 789,632 | 837,863 | 816,370 | 799,645 | 812,320 | 815,844 | 784,502 |
| 1990's | 784,118 | 834,637 | 871,905 | 886,455 | 888,500 | 907,795 | 958,178 | 963,759 | 937,798 | 972,616 |
| 2000's | 1,015,542 | 953,984 | 956,992 | 875,816 | 926,600 | 876,497 | 906,069 | 930,320 | 953,451 | 1,024,082 |
| 2010's | 1,066,366 | 1,134,473 | 1,250,012 | 1,356,709 | 1,608,148 | 1,706,584 | 1,807,934 | 1,897,242 | 2,234,593 | 2,547,897 |
| 2020's | 2,709,697 | 2,808,584 | 3,074,515 | 3,385,297 | 3,658,962 | 3,935,222 |
| - = No Data Reported; -- = Not Applicable; NA = Not Available; W = Withheld to avoid disclosure of individual company data. |
| Release Date: 5/29/2026 |
| Next Release Date: 6/30/2026 |