
Three producing regions drove U.S. natural gas production in 2021
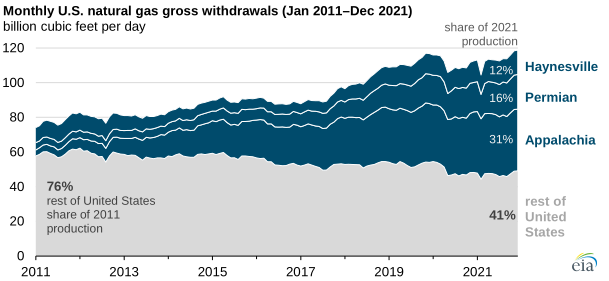
In 2021, U.S. natural gas production increased 2% and reached 118.8 billion cubic feet per day (Bcf/d) on a monthly basis in December 2021, the highest on record. Three regions drove this growth: Appalachia, Permian, and Haynesville, which collectively accounted for 59% of gross withdrawals in 2021 compared with 24% in 2011.
We measure U.S. natural gas production in this analysis as gross withdrawals (the most comprehensive measure of natural gas production). Our Drilling Productivity Report (DPR) measures natural gas production in selected onshore regions.
Natural gas production in the Appalachia region grew by 1.9 Bcf/d to 35.0 Bcf/d in 2021. Production growth in Appalachia over the past 10 years has been aided by improved productivity from wells drilled, pipeline buildouts, and increased takeaway capacity. However, regional transportation capacity limits have now been reached.
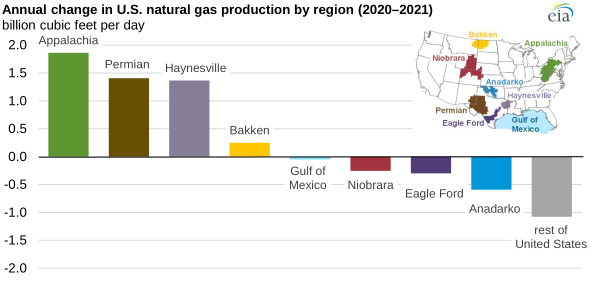
Natural gas production in the Permian region in western Texas and eastern New Mexico grew by 1.4 Bcf/d to 18.3 Bcf/d in 2021. Associated gas production (natural gas produced from oil wells) in the Permian region grew throughout the year, as crude oil prices remained relatively high.
In 2021, natural gas production in the Haynesville region in Louisiana and Texas grew by 1.4 Bcf/d to 13.2 Bcf/d. Because of relatively high natural gas prices in 2021, drilling in the Haynesville remained economical despite producers needing to drill deeper and more expensive wells. The higher development costs have been offset by the region’s better well productivity and its proximity to the Gulf Coast, where natural gas demand has been growing rapidly from liquefied natural gas export terminals and industrial facilities.
Principal contributors: Naser Ameen, Jim O’Sullivan
Tags: production/supply, natural gas, Haynesville, Permian, map