
Haynesville natural gas production is increasing but remains lower than previous peak
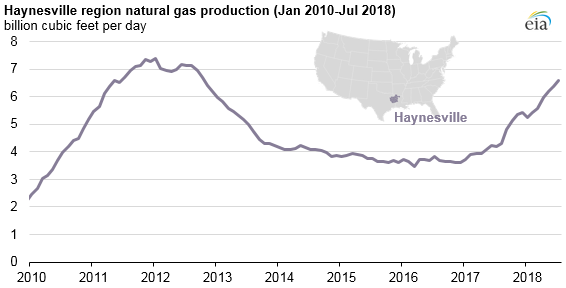
In June 2018, natural gas production in the Haynesville shale formation, located in northeastern Texas and Louisiana, averaged 6.4 billion cubic feet per day (Bcf/d), accounting for 8.5% of total U.S. dry natural gas production and the highest production from this region since September 2012. Monthly dry natural gas production in the Haynesville peaked at 7.4 Bcf/d in January 2012 and fell to less than half that level by early 2016. In 2017, the Haynesville formation was the third-largest producer of shale gas after the Appalachian production region—mainly in Pennsylvania, West Virginia, and Ohio—and the Permian production region in Texas and New Mexico.
The higher relative cost to produce natural gas from the Haynesville region played a large role in the production decrease experienced from 2013 to 2016. Natural gas production costs are dependent on many factors, including the cost of drilling wells. The Haynesville formation lies at depths of 10,500 feet to 13,500 feet, much deeper than the Marcellus, which is 4,000 to 8,500 feet deep. Because the deeper well depth makes drilling costs in the Haynesville shale generally more expensive than in the Marcellus and other shale plays, its production is more dependent on the price of natural gas.
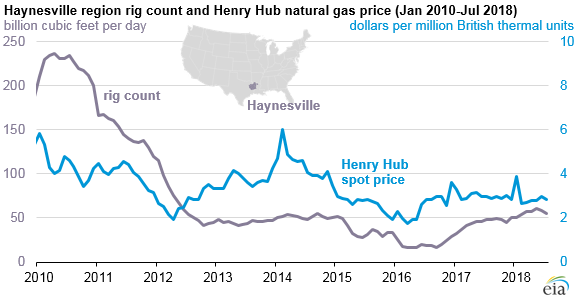
Higher natural gas prices—as priced at the national benchmark Henry Hub—can make it more economical for producers to spend the additional cost associated with drilling deeper to extract gas from the Haynesville formation. In 2010, when the Henry Hub price averaged $4.50 per million British thermal units (MMBtu), 223 rigs were operating in the Haynesville. As the Henry Hub price dropped, the rig count followed, ultimately reaching a low of 20 rigs in operation in mid-2016. Since then, the Henry Hub price has increased, recently surpassing $2.00/MMBtu, and the Haynesville rig count has steadily increased to average at least 50 rigs operating in each month so far in 2018.
In addition to the higher rig count, higher well productivity has contributed to the increase in production as the lateral length and initial production rate of each well have increased. From 2010 to 2017, average lateral lengths per well have increased from 4,269 feet to 6,421 feet, according to EIA calculations, based on DrillingInfo data.
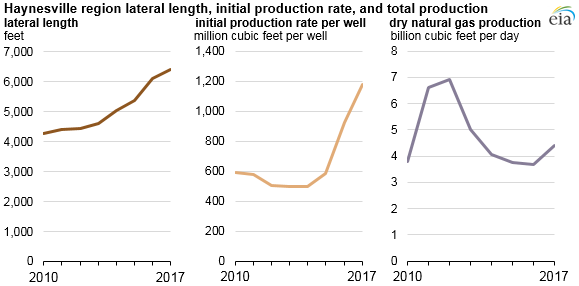
The initial productivity rate in the Haynesville region, calculated as the initial three-month cumulative production per well, has nearly doubled from 2010 to 2017, increasing from 589 million cubic feet (MMcf) per well to 1,176 MMcf/well. Productivity gains are expected to continue as producers optimize natural gas recovery from the Haynesville formation.
Principal contributor: Naser Ameen
Tags: production/supply, natural gas, shale, Haynesville