
U.S. crude oil production increases; imports remain strong to support refinery operations
United States refineries are some of the most complex in the world and can process a wide range of crude oil qualities. Although U.S crude oil production has grown significantly since 2009, having access to imports from oil producers around the world provides refiners with the range of crude oil quality that is optimum for each refinery’s configuration, maximizes profitability, and enables the refinery to either supply petroleum products for domestic consumption or export at competitive prices.
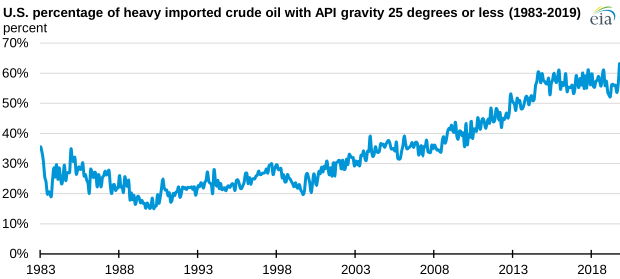
In general, domestically produced crude oil is light when compared with imported oil. For example, in 2018, 56% of the oil produced in Texas, the largest crude oil-producing state, was relatively light with an API gravity between 40 and 50 degrees. At the same time, 58% of imported crude oil was relatively heavy with an API gravity of less than 25 degrees. By augmenting the relatively light domestic crude oil production with relatively heavy crude oil imports, the United States has significantly increased its ability to export refined product. Because of higher domestic production, the United States has exported more oil and petroleum products, combined, than it has imported since September 2019.
U.S. refineries rely on imports as feedstock to optimize production and maximize profits. For example, as of January 2019, U.S. refineries had more than 3 million barrels per day of coking capacity. This capacity is used to process heavy and medium crude oils efficiently and would likely be underutilized if a refinery chose to only run domestically produced light crude oil because coking units are designed to convert heavy, low-value intermediates into high-value naphthas and distillates.
In addition to the differences in crude oil quality, the refiner acquisition cost of crude oil can be different for domestic and imported barrels. The refiner acquisition cost is the total amount that a refiner can expect to pay for crude oil, including freight costs and other transportation fees. Traditionally, heavy and medium crude oils trade at a discount to light, sweet crude oils. Since 2012, the increase in the share of imported crude oils with lower API gravity (heavier oil) has resulted in a lower refiner acquisition cost for imported crude oil when compared with the domestically produced higher API gravity (lighter oil) volumes.
The refiner acquisition cost has a direct impact on the profitability of a particular crude oil as a refinery feedstock, as measured with a 3:2:1 crack spread. Since 2013, the monthly average crack spread for U.S. refineries on the Gulf Coast (using PADD 3 refiner acquisition costs and U.S. Gulf Coast diesel and gasoline prices) has been greater for imported crude oil and only deviated from this pattern in six months of those years. Refineries that can import and process heavy, sour crude oil have an economic incentive to do so, even with expanding U.S. crude oil production.
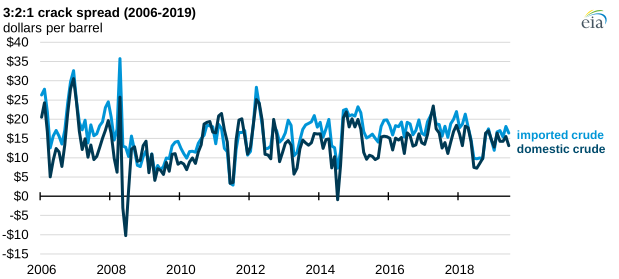
Note: Crack spreads are based on PADD 3 refiner acquisition cost and U.S. Gulf Coast product pricing.
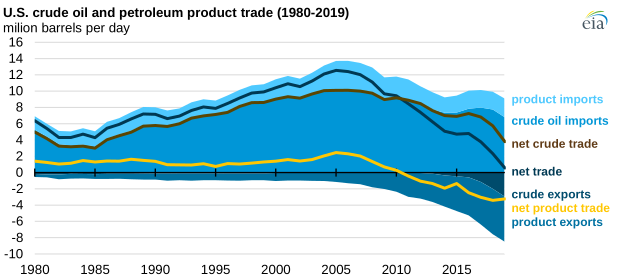
In September 2019, domestic crude oil production in the United States increased to more than 12 million barrels per day (b/d), making the United States a net exporter of petroleum (crude oil and petroleum products) for the first time since monthly records were established in 1973.
Crude oil imports reached a record-high average of 10.1 million b/d in 2005 and fell to an average of 6.8 million b/d in 2019. During this time period, the source of these imported heavy, high-sulfur crude oils significantly changed. In November 2019, more than 65% of U.S. crude oil imports came from Canada or Mexico. In addition, U.S. crude oil exports have increased since the restrictions on exporting domestically produced crude oil were lifted in December 2015. U.S. crude oil exports have increased from 591,000 b/d in 2016 to 3.0 million b/d in 2019. In the Annual Energy Outlook 2020 Reference case, EIA projects that the United States will remain a net exporter of total petroleum liquids; however, the United States will remain a net importer of crude oil through 2050.
Principal contributor: Peter Colletti