
An introduction to crack spreads
2011 U.S. Gulf Coast conventional gasoline crack spread
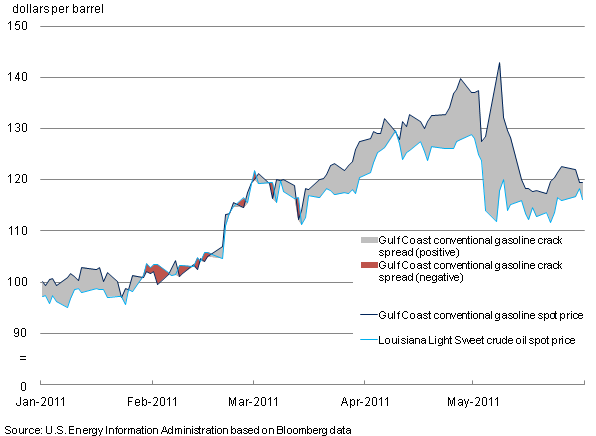
Crack spreads are differences between wholesale petroleum product prices and crude oil prices. These spreads are often used to estimate refining margins. Crack spreads are a simple measure based on one or two products produced in a refinery (usually gasoline and distillate fuel). They do not take into consideration all refinery product revenues and exclude refining costs other than the cost of crude oil.
The chart above shows recent trends in a single product crack spread, or the difference between the U.S. Gulf Coast conventional gasoline spot price (the black line) and the Louisiana Light Sweet crude spot price (the blue line). Crack spreads can be positive (the grey shaded region) or negative (the red shaded region), depending on relative product prices.
By comparing the price of crude oil (which is set in a global marketplace) with the price of refined products (which can be affected by local and seasonal factors), crack spreads can often give an indication of supply conditions in a given market.
Crack spreads can be calculated using either a single product or multiple products:
- Single-product crack spreads: A single-product crack spread reflects the difference in value between a barrel of the specified product and a barrel of crude oil. A common single-product crack spread is the gasoline crack spread, as shown in the figure. It is possible to use various combinations of crude oil and refined products to calculate crack spreads. For example, you can calculate the crack spread for RBOB gasoline sold in the U.S. Gulf Coast market compared to the price of crude oil. For the crude oil price, one could use the price for either West Texas Intermediate (WTI) crude oil, which has recently been impacted by transportation bottlenecks at the main WTI market hub, or Louisiana Light Sweet (LLS) which has not been affected by bottlenecks and has continued to move closely with comparable quality global supply streams. Other alternatives involve calculating the gasoline crack spread in different locations (RBOB crack spreads in New York Harbor versus the Gulf Coast) or using different types of gasoline (conventional crack spreads versus RBOB crack spreads).
- Multiple-product crack spreads: The most common multiple-product crack spread is the 3:2:1 crack spread. A 3:2:1 crack spread reflects gasoline and distillate production revenues from the U.S. refining industry, which generally produces roughly 2 barrels of gasoline for every barrel of distillate. The 3:2:1 crack spread is calculated by subtracting the price of 3 barrels of oil from the price of 2 barrels of gasoline and 1 barrel of distillate. Additional ratios used for multiple-product crack spreads include 5:3:2 and 2:1:1.
Tags: crack spread, crude oil, gasoline, liquid fuels, oil/petroleum, prices, refining