Solar photovoltaic costs are declining, but estimates vary across sources
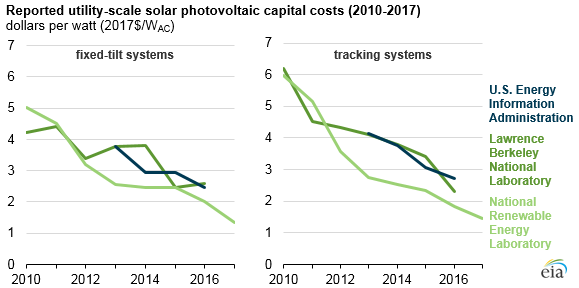
Note: EIA values for 2016 are preliminary. Values shown for EIA and LBNL are the capacity-weighted values. LBNL also publishes other cost metrics in their report, including median and range values.
Costs for utility-scale solar photovoltaic (PV) systems have declined in recent years—most sources show that system costs on a per-watt basis have fallen about 10% to 15% per year from 2010 through 2016. The level of those costs in certain years often varies across sources for reasons largely attributable to the way these costs are estimated.
To estimate capital costs of generating technologies, analysts use one of two common methods—total reported costs or aggregated component costs. Both approaches help explain the cost of utility-scale solar PV systems.
Reported costs: Using actual project data provides an empirical analysis that captures a large range of reported project costs in the market and accounts for the substantial variability in project design, location, and timing observed in the real world. Challenges with this approach include uncertainty about whether certain cost components are included in reported system costs, such as interconnection costs and the treatment of financing expense. Also, the data for each year reflect projects completed in that year, which do not necessarily reflect the costs of projects initiated in that year.
Component costs: The component cost approach provides more detail on the impact of changes in component-level technology and costs, which can be significant in a fast-moving market like solar PV. Such approaches typically represent either best-in-class or common-practice project criteria and do not necessarily capture the wide range of real-world project cost factors. Estimates that exclude financing expenses are called overnight estimates (i.e., as if the plant could be built instantly with no financing requirement). Component-based estimates may not reflect all potential costs to a system, such as developer profit margins.
EIA started collecting data on total capital costs directly from project owners as a part of the Form EIA-860 Annual Electric Generators Report in 2013. Because of respondent confidentiality, EIA only publishes capacity-weighted average values of new projects coming online each year and has published data for 2013, 2014, and 2015. This data series includes facilities with a nameplate capacity of at least one megawatt of alternating current. Respondents are asked to exclude government incentives and financing expenses from the reported costs.
The U.S. Department of Energy’s Lawrence Berkeley National Laboratory (LBNL) begins with EIA’s capital cost dataset and gathers additional information from corporate financial reports, Federal Energy Regulatory Commission (FERC) filings, and the U.S. Department of the Treasury’s Section 1603 grant database. LBNL’s annual Utility-Scale Solar Report defines utility-scale solar facilities as those with at least five megawatts or more of alternating current, which cuts out some of the smaller plants included in EIA’s Electric Generator Report.
The U.S. Department of Energy’s National Renewable Energy Laboratory (NREL) publishes the Solar PV System Cost Benchmark report with estimates of total system costs based on the most up-to-date information on reported component costs and conversations with industry. These costs do not include additional net profit components, which are common in the marketplace. Also, NREL’s bottom-up approach models costs for a project sized at 100 megawatts of direct current, which is large enough to have realized some economies of scale relative to smaller systems.
EIA also projects future capital costs as part of the Annual Energy Outlook (AEO). Starting costs of solar PV come from contracted capital cost studies based on information on system design, configuration, and construction derived from actual or planned projects, using generic assumptions for labor and materials rates.
Although EIA does not update the capital cost study each year, in years where the report data are not updated, EIA extrapolates cost trends observed in the literature, including the sources noted above, and considers expected cost declines from learning-by-doing. For 2018, AEO2018 projects installed capital costs of $1.85 per watt (AC) for fixed-tilt PV systems and $2.11 per watt (AC) for single-axis tracking systems.
Principal contributor: Cara Marcy
Tags: electricity, generation, solar