
EIA publishes construction cost information for electric power generators
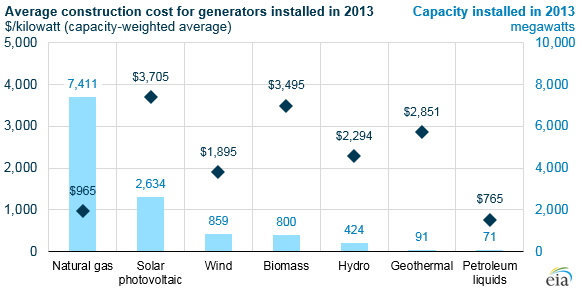
Note: Average costs are weighted by nameplate capacity. Solar photovoltaic (PV) data are based on reported alternating current (AC) capacity and do not include distributed generation capacity.
Many factors influence the economic competitiveness of electricity generation technologies; however, two fundamental factors are the cost of constructing generators and the cost of operating them. The U.S. Energy Information Administration (EIA) recently began collecting construction costs for new electric generators at utility-scale power plants. The publication released today covers generators installed in 2013 and includes average costs by technology type or region. EIA expects to publish 2014 construction cost information in August 2016 and 2015 information in October 2016.
Industry reports and other EIA publications have included various estimates of electricity generation technology capital costs, but this is the first time EIA has collected and reported actual construction costs, which include capital and financing costs, for all new generators. Government grants, tax benefits, or other incentives are excluded from these costs. Because the data are business-sensitive and protected, the analysis presents averaged costs for select groupings and excludes certain generation technologies to avoid disclosure of individual company data. The reported costs reflect a snapshot of market prices for generation technologies at the time the projects were developed and built.
Construction costs alone do not tell the full story of the relative economics of each electricity generation technology. For fuel-consuming electricity generation technologies, fuel costs often make up a substantial portion of the plant's total costs. For nonfuel-consuming technologies such as wind and solar plants, the initial construction cost constitutes most of the plant's total costs. In addition, federal, state, and local programs may provide incentives to lower the cost of certain technologies. Finally, different types of plants often run at different utilization rates, which affects the relative economics of generation technologies. As costs, market conditions, and government policies have drastically changed over the years, so has the pattern of capacity additions.
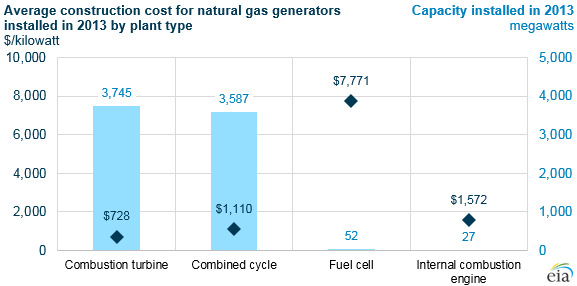
Note: Average costs are weighted by nameplate capacity.
Natural gas. Most of the electricity generation capacity added in 2013 came from natural gas technologies with average construction costs of $965 per kilowatt (kW) of installed nameplate capacity. Most of the natural gas electricity generators installed in 2013 were combustion turbine and combined-cycle plants. Combustion turbine plants, which typically serve as peaker plants and run mainly during times of peak demand, are less expensive to build than combined-cycle plants but more expensive to operate because of their relatively low energy conversion efficiency (the inverse of which is known as the heat rate). Combined-cycle plants, which include at least one combustion turbine and one steam turbine, are more efficient and less expensive to run than combustion turbines. For that reason, combined-cycle plants usually have much higher utilization rates than combustion turbines and typically serve as intermediate or baseload plants. Combustion turbine and internal combustion engine plants can often be built quickly (within a year) and can help meet near-term localized supply or reliability needs.
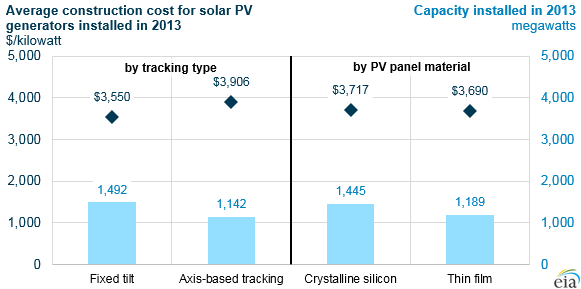
Note: Average costs are weighted by nameplate capacity. Solar PV data are based on reported alternating current (AC) capacity and do not include distributed generation capacity.
Solar. Solar additions in 2013 had average construction costs of $3,705/kW. Solar photovoltaic (PV) projects using an axis-based tracking system were more expensive per kilowatt than fixed-tilt projects but are generally used for larger projects. Tracking systems can increase system output, which may justify the somewhat higher costs. The average costs for projects using thin-film panels versus crystalline silicon panels were similar, but the new thin-film plants have a much larger capacity on average (74 MW) than the new crystalline silicon plants (7 MW), which likely influenced the per-kilowatt costs, along with other factors. The solar PV data are based on reported alternating current (AC) capacity and may differ from other cost and capacity estimates that use direct current (DC) ratings of PV panels. The data, which are for utility-scale plants only (nameplate capacity of 1 MW or more), do not include distributed solar installations, such as those found on residential and commercial rooftops.
Wind. The average construction cost of wind generators was $1,895/kW, the lowest of all renewable technologies. Despite this cost advantage, the reported new wind capacity in 2013 was less than 900 MW, a significant drop from additions of 13,084 MW in 2012, primarily because of the expiration of the federal production tax credit at the end of 2012. The tax credit was renewed in early 2013, but given the lead times for a wind project and a change in the tax credit's eligibility requirements, very few wind plants were completed in 2013.
Principal contributors: Suparna Ray, April Lee