Solar plants typically install more panel capacity relative to their inverter capacity
A solar photovoltaic (PV) system’s panel capacity is often reported in direct current (DC), while operating capacity in the United States is reported as it is delivered to the grid in alternating current (AC). For economic and engineering reasons, capacity values reported in DC typically are 10% to 30% higher than those reported in AC capacity. This ratio is often referred to as the inverter loading ratio (ILR).
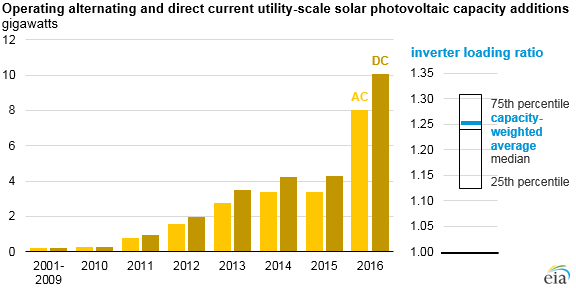
At the end of 2016, the United States had 20.3 gigawatts (GW) AC of large-scale photovoltaic capacity in operation with a DC module rating of 25.4 GW, resulting in a capacity-weighted average ILR of 1.25. For individual systems, inverter loading ratios are usually between 1.13 and 1.30.
Developers of solar PV facilities intentionally over-build the DC capacity of their system relative to the AC output for a few reasons. The output of a solar PV system is dependent on the availability of the sun. Because the output of panels may only reach peak DC capacity a few hours out of the year, it may not be cost effective to size an AC inverter to capture that full output.
PV panels’ output not only changes over the course of the year, when the sun is at different altitudes in the sky, but output also declines as solar PV cell/module performance degrades over time. PV system designers also take these considerations into account and size the inverter to be large enough to capture most of the output of the system over its lifetime, but not so large that the incremental increase in inverter capacity becomes uneconomic.
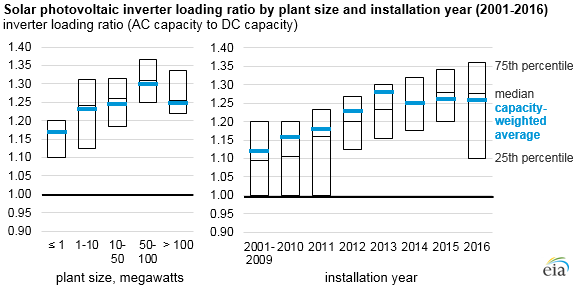
Inverter loading ratios are higher for larger solar power plants. At the end of 2016, smaller plants—those one megawatt (MW) or less in size—had an average ILR of 1.17, while larger plants—those ranging from 50 MW to 100 MW—had an ILR of 1.30. As solar plants have gotten larger, inverter loading ratios have increased. In 2010, the average solar PV system had an ILR of 1.17. By 2016, the average was 1.26.
Note: Includes 1,804 plants with a total of 20.3 GW of AC capacity and 25.4 GW of DC capacity.
Even though some PV installations are often discussed in terms of DC capacity—because DC capacity more accurately captures the rating of the panels—EIA reports all electricity capacity data in terms of the systems’ AC capacity because electricity operations and sales in the United States are generally conducted on an AC basis.
This approach applies to not just capacity values but also to costs and operation characteristics. For example, the AC capacity factor for solar PV facilities operating in 2017 was 27%. If this value were estimated using DC capacity, the DC capacity factor would be about 22%. Similarly, the average capital costs for utility-scale solar PV facilities installed in 2015 were $2.91 per watt in terms of AC capacity and about $2.33 per watt in terms of the DC capacity of the PV modules.
Principal contributor: Cara Marcy
Tags: capacity, electricity, generation, solar