Solar photovoltaic output depends on orientation, tilt, and tracking
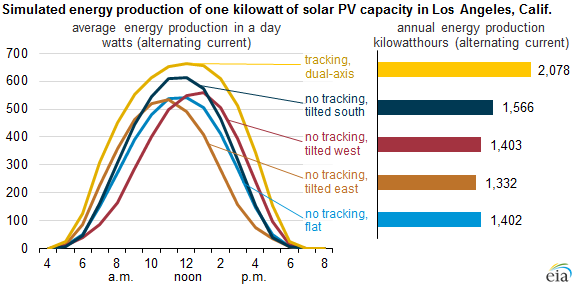
Note: Tilted systems are assumed to be mounted with a 20-degree tilt from horizontal. The assumed system size is one kilowatt of direct current, with output in watthours of alternating current.
Financial incentives, renewable portfolio standards, cost declines, and system performance improvements have led to more customer-sited solar photovoltaic (PV) installations, especially in states such as California. Because PV panels are able to capture more solar energy when they are pointed directly at the sun, installers may configure systems to optimize output by adjusting the orientation and tilt of a system, or by using mechanisms that track the sun as it traverses the sky.
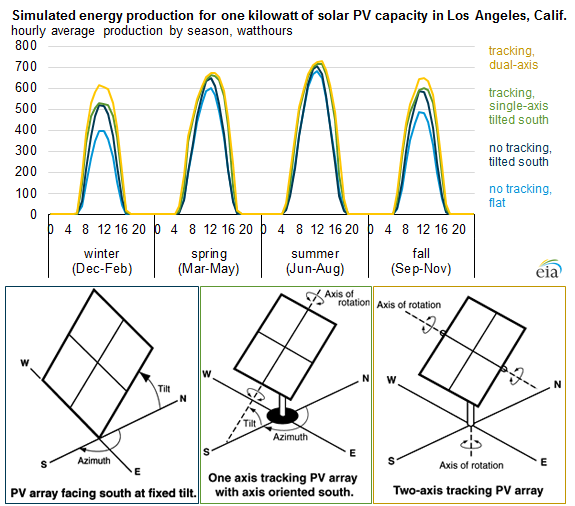
Installers will generally determine the tilt of a system—or the angle between the module and the horizontal—to optimize overall or seasonal performance. Assuming that a system has tilted modules, installers will generally set the orientation—or direction—of that tilt to optimize overall or time-of-day performance. In the Northern Hemisphere, the simplest way to maximize total annual system output of a fixed-tilt system is to tilt the panels south. The tilt angle may increase with latitude: the farther away from the equator, the higher the tilt.
However, while solar radiation peaks around noon, electricity demand often peaks in the afternoon or early evening. In these last few hours of daylight, west-facing PV panels have an advantage over south-facing panels, as they're tilted towards the setting sun. Higher PV output at this time of day is often beneficial to grid operators working to increase electric supply to balance high levels of demand, but customers generally will not see this benefit unless they are on time-of-use electric rates. For example, under net-metering arrangements, the financial benefit of these PV systems is based on the quantity of kilowatthours generated, regardless of the time of day.
As part of California's Solar Initiative (CSI), the characteristics of each distributed (nonutility) solar PV system are cataloged in their California Solar Statistics database. Based on this California data, about two-thirds of the fixed-tilt systems that were installed so far in 2014 are tilted between 11 and 30 degrees. Residential and small commercial systems generally have higher tilt angles, likely matching the pitch of the roofs these systems are often installed on.
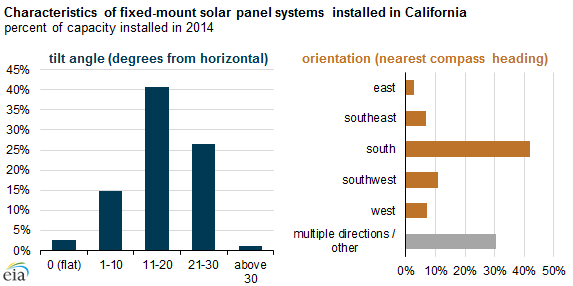
Note: Excludes systems installed with multiple tilt angles. Systems will multiple arrays of varying orientations are classified as multiple directions.
Tilt angles may reflect factors other than generator performance. Some installation sites may not be conducive to tilted arrays or specific orientations. In the case of pitched (sloped) roofs, an installation with an orientation or tilt that differs from that of the roof can be more costly, and can affect the visual impact of the system. Tilted arrangements can require more surface area to deal with shading issues, may be subject to increased wind damage, and require more costly mounting structures. Some installers have tried different installation approaches to alleviate the shading issue while also capturing more sunlight early and late in the day compared to south-facing arrangements.
Customers with higher electricity consumption (such as commercial, industrial, and institutional customers) are more likely to be on time-of-use rates, providing them with the financial incentive to consider both the amount and the timing of generating electricity. For this reason, these larger installations are more likely to use yet another option: tracking systems. Single-axis tracking systems are installed on tilted arrays, but they rotate the panels to follow the sun as it moves east to west, improving output in the early and late hours of daylight. Dual-axis tracking systems do this, too, while also modifying the tilt angle as the sun is lower or higher in the sky.
In addition to increasing total annual output, tracking systems also help reduce seasonality in solar output. However, tracking systems are still relatively rare. For systems greater than 10 kilowatts (kW) installed in California so far this year eligible for support from the CSI, 30% of the capacity was installed using single-axis tracking systems and 4% either used dual-axis tracking or a mix of tracking and fixed mounts, but the majority of the capacity (66%) was on fixed mounts. Virtually all (more than 99.9%) of the capacity under 10 kW installed in California this year have fixed mounting without any tracking.
Principal contributor: Owen Comstock
Tags: California, electricity, solar, states