Natural gas power generation share grew in Southern states for a decade as coal declined
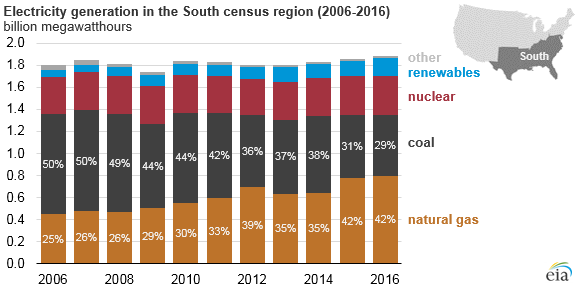
Coal’s share of total electricity generation in the South declined over the past decade, from 50% in 2006 to 29% in 2016. As the use of coal has declined, the use of natural gas has increased. In 2016, southern states used natural gas for 42% of their electricity generation, a bigger share than the U.S. average of 34%.
The mix of fuels used to generate electricity varies among southern states, but the overall mix is dominated by natural gas and coal. At the state level, natural gas made up as much as 89% of in-state electricity generation in Delaware to as little as 2% in West Virginia.
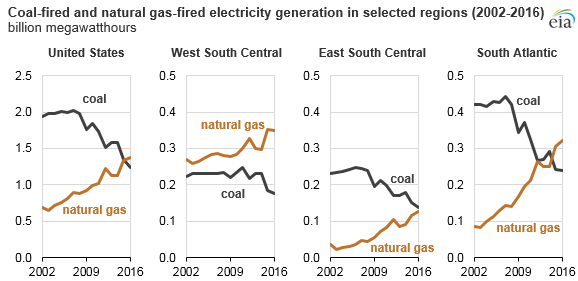
Competition between the fuels for electricity generation has resulted in U.S. net generation of electricity from natural gas surpassing coal for the first time in 2016. For the South as a whole, natural gas surpassed coal for electricity generation in 2012, 2015, and 2016.
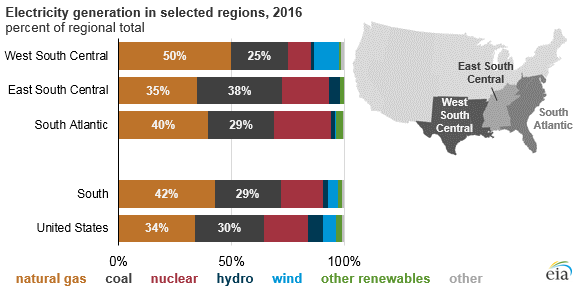
Within the South, the share of natural gas used for electric generation in the West South Central census division—which includes Arkansas, Louisiana, Oklahoma, and Texas—has been larger than the share of coal for more than a decade. In the East South Central division, which includes Alabama, Kentucky, Mississippi, and Tennessee, coal-fired electricity generation remains higher than natural gas-fired generation, although the difference has narrowed. In the South Atlantic division, which includes West Virginia, Maryland, and Delaware and extends along the Atlantic Ocean to Florida, natural gas first surpassed coal used for electricity generation in 2015.
Most Southern states that use coal for the largest share of their electricity generation are part of the Northern or Central Appalachian basins, two of five major coal mining regions in the United States. West Virginia and Kentucky are among the top five coal mining states, and both states use coal for most of their electricity generation—94% and 83%, respectively. Tennessee, Arkansas, and Maryland also used more coal (37%–39%) than the national average of 30% in 2016.
More coal-fired generating units were retired in the South between 2006 and 2016 than units fueled by any other fuel type, with 20.8 gigawatts (GW) of capacity taken offline during that period. Although 9.6 GW of coal capacity was added between 2007 and 2013, no coal units have been installed since 2013. New installed capacity in the region came primarily from natural gas and wind, with an additional 47.0 GW and 25.6 GW installed, respectively, between 2006 and 2017.
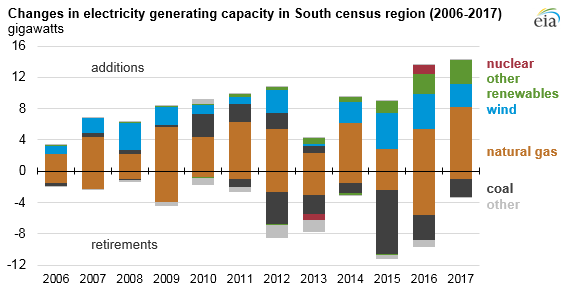
Note: 2017 values are preliminary.
Wind additions in the South have been concentrated in Texas and Oklahoma, which ranked first and third nationally for total installed wind capacity as of September 2017. Texas and Oklahoma are in a region with some of the country’s best wind resources.
The South is home to both the newest nuclear power generator (Watts Bar Unit 2 in Tennessee) and the only new nuclear plant still under construction (the Vogtle plant in Georgia). Earlier this year, construction of the V.C. Summer nuclear power plant in South Carolina was canceled.
Principal contributor: Lisa Cabral