Wind turbines provide 8% of U.S. generating capacity, more than any other renewable source
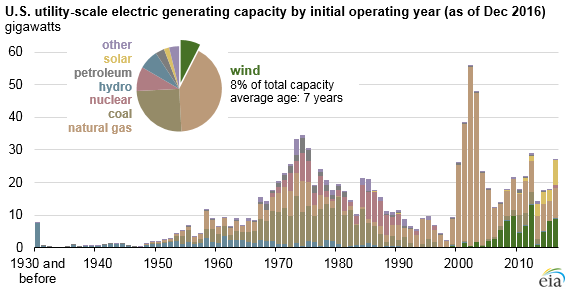
Wind generators accounted for 8% of the operating electric generating capacity in the United States in 2016, more than any other renewable technology, including hydroelectricity. Wind turbines have contributed more than one-third of the nearly 200 gigawatts (GW) of utility-scale electricity generating capacity added since 2007. The increase in wind development in the United States over the past decade reflects a combination of improved wind turbine technology, increased access to transmission capacity, state-level renewable portfolio standards, and federal production tax credits and grants.
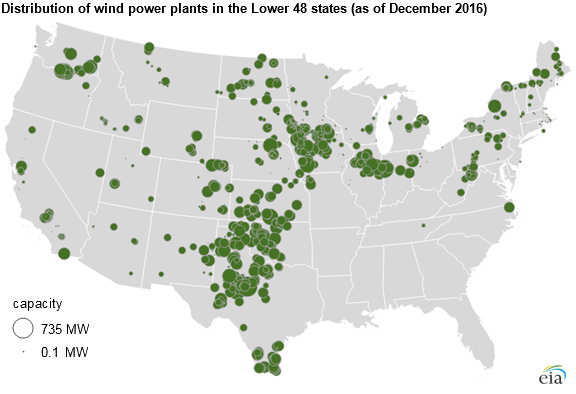
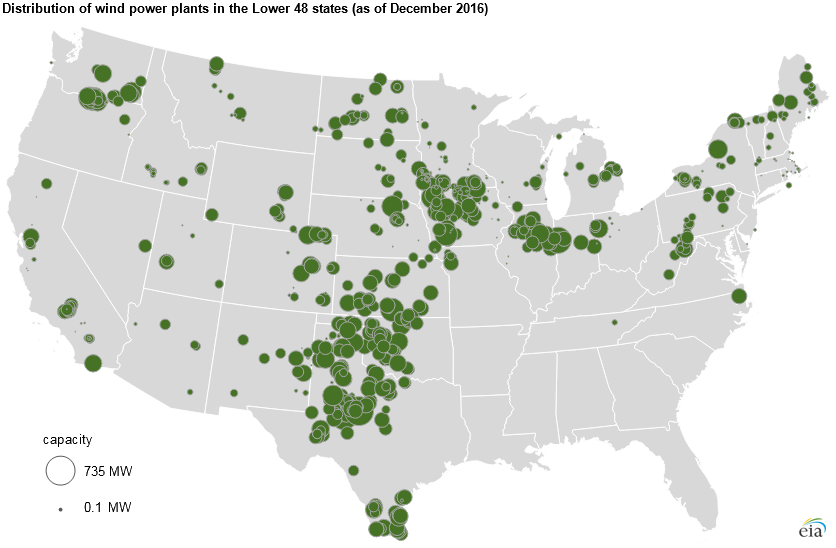
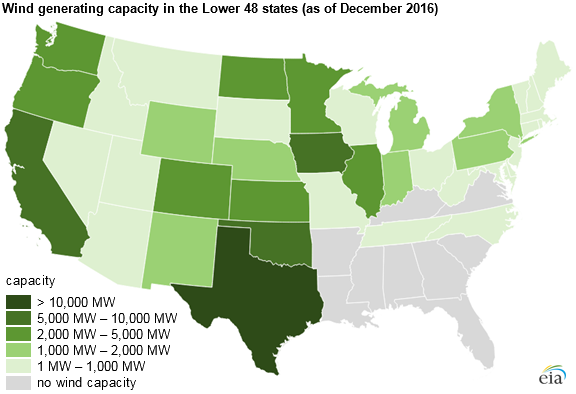
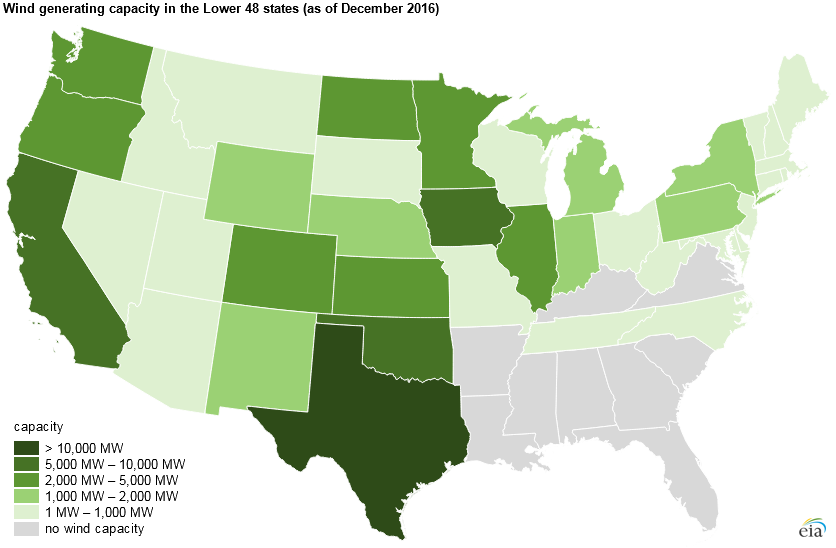
More than half of U.S. wind capacity is located in five states: Texas, Iowa, Oklahoma, California, and Kansas. In three states—Iowa, Kansas, and Oklahoma—wind makes up at least 25% of in-state utility-scale generating capacity. Several states with the highest wind capacity are located in the Midwest, a region with favorable wind resources. As of December 2016, nine U.S. states had no operational utility-scale wind facilities: Alabama, Arkansas, Florida, Georgia, Kentucky, Louisiana, Mississippi, South Carolina, and Virginia.
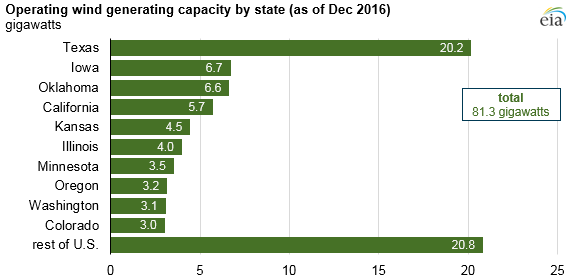
Texas alone accounts for almost a quarter of total U.S. wind capacity, and electricity generated by these turbines made up 13% of Texas's total electricity output in 2016. At particularly windy times, wind can provide a much larger share of Texas’s electricity generation. For instance, in the early hours of March 23, 2017, wind output on the Electric Reliability Council of Texas (ERCOT) grid in Texas accounted for up to 50% of the electricity generation mix, the highest wind penetration level seen in the ERCOT electric system to date.

Although wind makes up about 8% of total U.S. electricity generating capacity, wind generators provided a smaller share (5%) of total U.S. electricity generation in 2016 because wind turbines have relatively low capacity factors. Capacity factors, which measure actual output over a certain period as a percent of the total mechanical ability of the turbine to generate given sufficient wind, average between about 25% and 40% for wind generators and vary based on seasonal patterns and geographic location.
The average wind generating facility in the United States consists of about 50 turbines. However, the Alta Wind Energy Center in Kern County, California, is the largest wind power site in the United States with 586 turbines and a combined 1,548 megawatts (MW) of capacity across several separate projects.
Until late 2016, all U.S. wind capacity was on land. The first U.S. offshore wind project, Block Island Wind Farm, began commercial operation off the coast of Rhode Island in December 2016 with a generating capacity of 29.3 MW. Two other offshore wind projects off the coasts of Ohio and Virginia are not yet under construction but are seeking regulatory approvals.
Source: U.S. Energy Information Administration, Preliminary Monthly Electric Generator Inventory
Note: Click to enlarge.
Source: U.S. Energy Information Administration, Preliminary Monthly Electric Generator Inventory
Note: Click to enlarge.
This article is part of a series of Today in Energy articles examining the fleet of utility-scale power plants in the United States. Other articles have examined hydroelectric, coal, natural gas, nuclear, solar, petroleum, and other generators.
Principal contributor: Tosha Beckford
Tags: capacity, electricity, generation, map, renewables, states, wind