U.S. wind generating capacity surpasses hydro capacity at the end of 2016
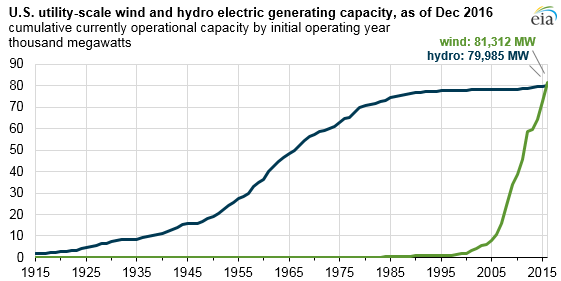
Note: Data include facilities with a nameplate capacity of one megawatt and above.
Installed wind electric generating capacity in the United States surpassed conventional hydroelectric generating capacity, long the nation’s largest source of renewable electricity, after 8,727 megawatts (MW) of new wind capacity came online in 2016. However, given the hydro fleet’s higher average capacity factors and the above-normal precipitation on the West Coast so far this year, hydro generation will likely once again exceed wind generation in 2017.
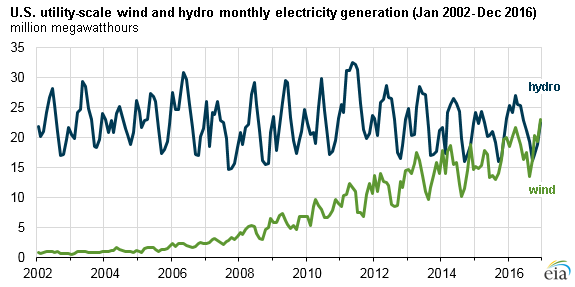
Note: Data include facilities with a nameplate capacity of one megawatt and above.
Wind and hydro generation both follow strong seasonal patterns. Hydro generation typically reaches its seasonal peak in the spring and early summer, especially in the Pacific Northwest and California where about half of U.S. hydropower is produced. Across most of the country, wind generation typically peaks in the spring with a smaller peak in late fall and early winter. The Pacific Northwest and California have a slightly different seasonal pattern for wind resources, with generally only one peak in the early summer.
In the Southwest Power Pool (SPP) electric system, which extends from northern Texas to North Dakota and Montana, wind power recently supplied more than half of the system’s generation mix for a brief period, reaching 52.1% (11,419 MW) in the early hours of February 12, 2017—a first for any of the seven U.S. regional transmission organization (RTO) electric systems that together serve two-thirds of the country’s electricity consumption.
The Electric Reliability Council of Texas (ERCOT) system which covers most of Texas continues to set records for the highest level of wind generation on any U.S. electric system. ERCOT’s most recent record of 16,022 MW occurred on the morning of December 25, 2016, and accounted for slightly more than 47% of the generation mix at the time.
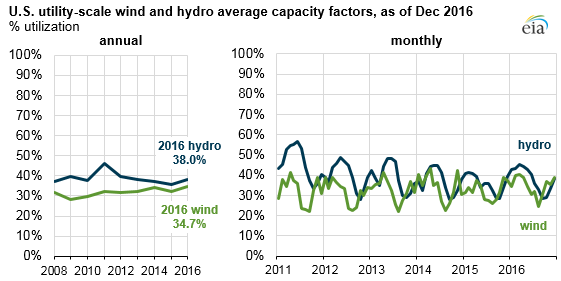
Note: Data include facilities with a nameplate capacity of one megawatt and above.
Compared with other electricity generating sources such as nuclear, geothermal, and combined-cycle natural gas, hydro and wind have lower average capacity factors (i.e., generation output as a percentage of total generating capacity). Both sources are sensitive to fluctuations in weather conditions such as droughts, heavy precipitation, and changes in regional wind patterns. Given the hydro fleet's historically higher capacity factors compared with wind and the expected strong hydrological conditions on the West Coast this year, such as the recent heavy rainfall in California and the Pacific Northwest, hydro generation in 2017 will likely still be higher than wind generation even with anticipated continuing additions of new wind capacity throughout the year.
For electricity reliability planning purposes, hydro and wind capacity are reduced (or derated) when estimating their expected contributions to meet projected peak-period electricity demand. Hydro capacity is generally derated to a much lesser degree than wind capacity. The North American Electric Reliability Corporation’s (NERC’s) latest summer reliability assessment shows the difference between the nameplate capacity and the expected on-peak capacity for variable renewable sources (wind, solar, and hydro) in each region. In both SPP and the PJM Interconnection electric system, which covers a highly populated area of Mid-Atlantic, Southern, and Midwestern states, hydro provides more expected on-peak capacity than wind even though there is about twice as much installed wind capacity as hydro capacity in both regions.
Principal contributor: April Lee
Tags: California, capacity, capacity factor, electric generation, electricity, electricity generating fuel mix, generating capacity, generation, hydroelectric, ISO (independent system operator), Midwest, NERC (North American Electric Reliability Corporation), North Dakota, Northwest, Oregon, power plants, renewables, RTO (regional transmission organization), states, Texas, Washington, weather, wholesale power, wind