Oil-fired power plants provide small amounts of U.S. electricity capacity and generation
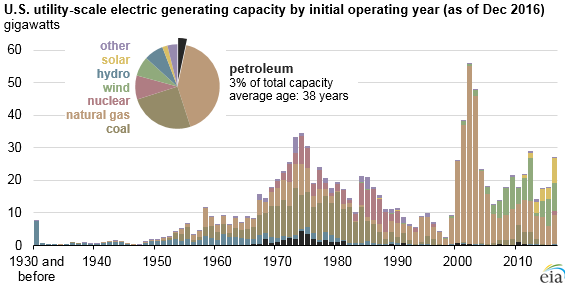
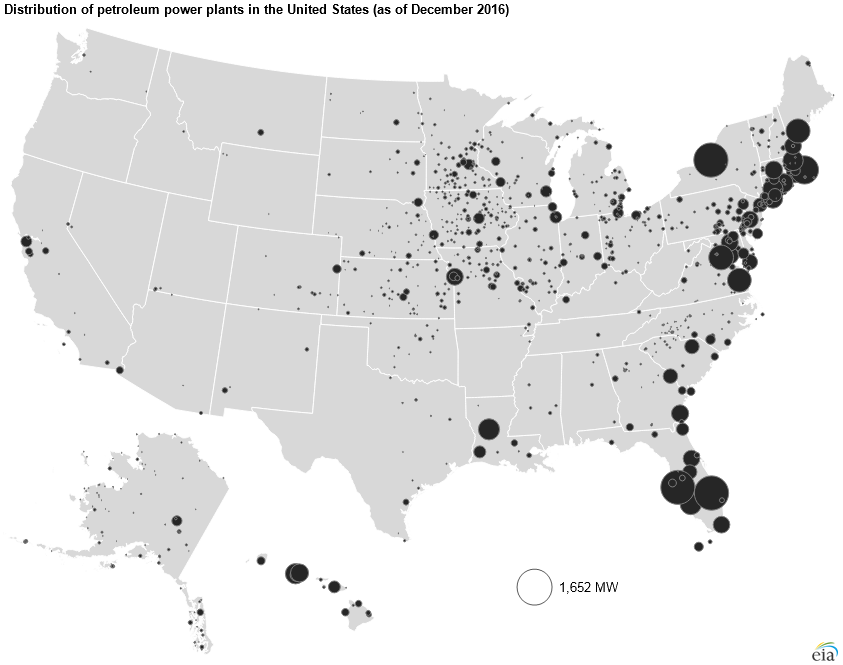
Roughly 70% of petroleum-fired electric generating capacity that still exists today was constructed prior to 1980. Utility-scale generators that reported petroleum as their primary fuel comprised only 3% of total electric generating capacity at the end of 2016 and produced less than 1% of total electricity generation during 2016.
Power plants that burn petroleum liquids (such as distillate or residual fuel oils) are generally used for short periods during times of peak electricity demand. Otherwise, petroleum-fired power plants operate mostly at low capacity factors because of the high price of petroleum relative to other fuels, air pollution restrictions, and lower efficiencies of their aging generating technology. Most oil-fired generators are either turbines or internal combustion engines used to supply power only at times of peak electric power demand or when natural gas prices rise due to local natural gas demand.
A fundamental shift in the perception of oil as a utility fuel occurred during the 1970s when world oil markets experienced sharp price increases. Supply shortages during world events such as the Arab Oil Embargo, the Iranian Revolution, and the Iran-Iraq war also discouraged petroleum-fired electricity generating capacity additions in the United States.
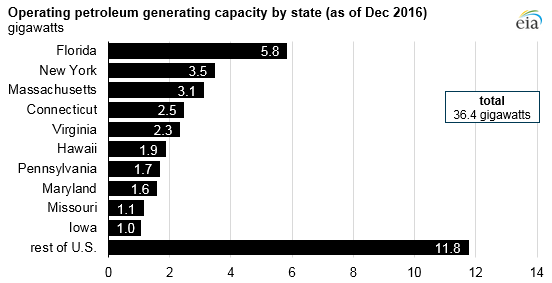
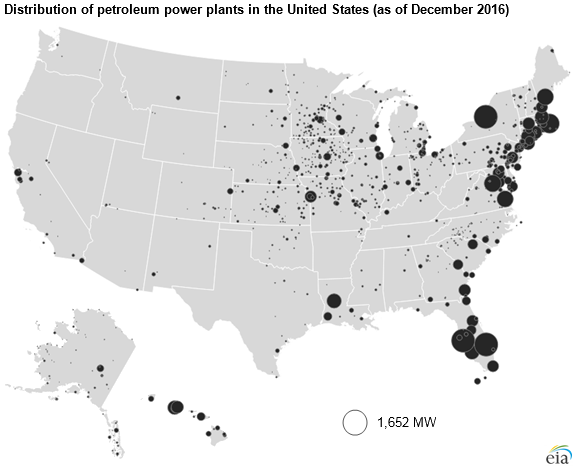
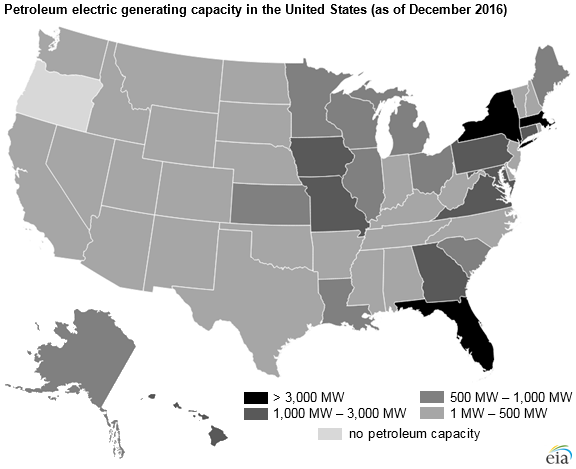
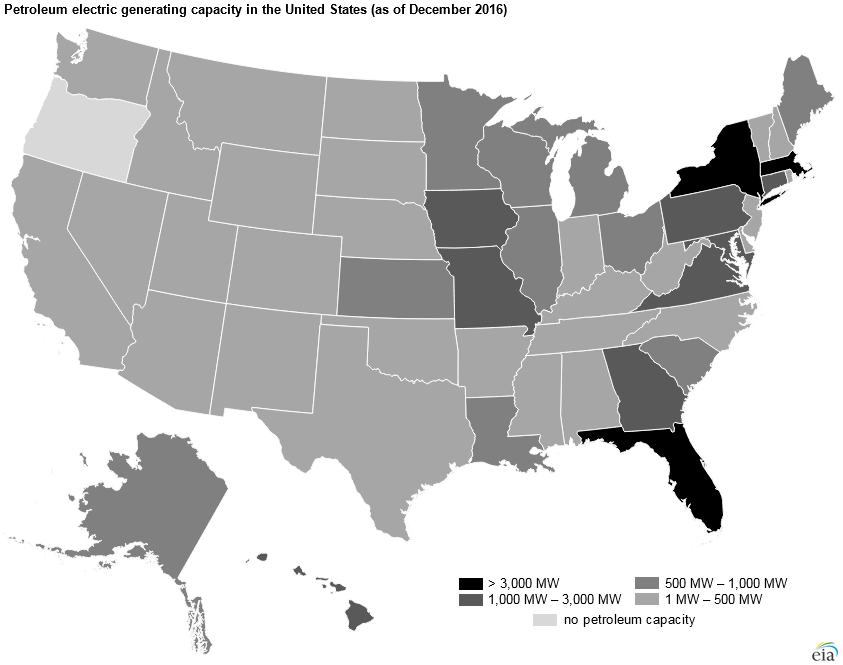
Of the 36.4 gigawatts of domestic petroleum-fired generating capacity, more than 68% is located in 10 states, primarily in coastal states with access to marine ports. When these plants were built in the 1970s, coal-fired generators were the main sources of electricity generation. However, coastal states like Florida are relatively far from coal production areas. Because coal is primarily transported by rail, the cost of long-haul coal transport by rail may not be competitive in these areas compared with oil delivered by marine modes.
In recent years, monthly generation from petroleum-fired generators has totaled 1 million to 2 million megawatthours. However, in both January 2014 and January 2015, petroleum-fired generation spiked when cold winters in New England created high demand for the region’s natural gas supply and petroleum generators were needed to meet load.
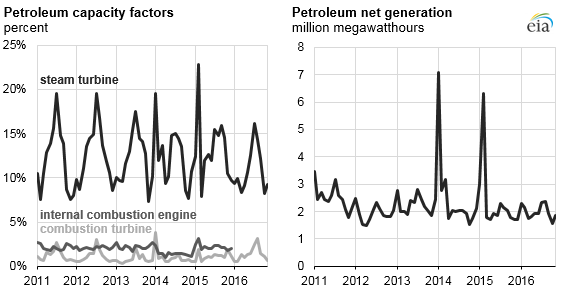
Note: Capacity factors for internal combustion engines in 2016 is not available.
Because oil-fired generators tend to be used to meet electricity demand for times of peak demand, oil-fired generators generally have lower capacity factors and higher heat rates than most other types of power plants. Capacity factors—which measure actual output as a percent of total capacity—for oil-fired steam turbines are about 10% and approach 20% only in the summer months. Capacity factors for oil-fired combustion turbines and internal combustion engines are lower, remaining well below 5%.
Some power plants are capable of switching between fuels, potentially complicating the calculation of capacity factors. For instance, plants that normally burn natural gas may choose to burn petroleum during times of high natural gas demand. EIA calculates capacity factors based on the primary fuel of each power plant, so the consumption of petroleum fuels in plants that primarily consume natural gas would be reflected in petroleum’s net generation but may not be reflected in the petroleum capacity factor series.
Source: Source: U.S. Energy Information Administration, Preliminary Monthly Electric Generator Inventory
Note: Click to enlarge.
Source: Source: U.S. Energy Information Administration, Preliminary Monthly Electric Generator Inventory
Note: Click to enlarge.
This article is part of a series of Today in Energy articles examining the fleet of utility-scale power plants in the United States. Other articles have examined hydroelectric, coal, natural gas, nuclear, wind, solar, and other generators.
Principal contributor: Kenneth Dubin
Tags: capacity, coal, electricity, generation, liquid fuels, natural gas, oil/petroleum, prices