
NOAA predicts relatively quiet Atlantic hurricane season
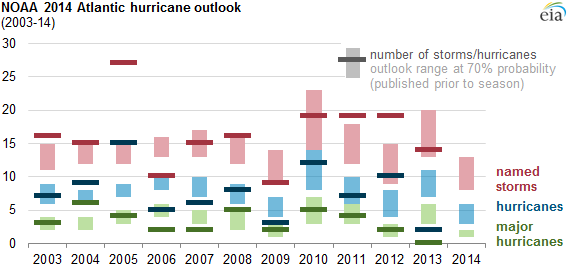
Note: NOAA classifies named storms as hurricanes when their maximum sustained surface wind exceeds 74 miles per hour, and major hurricanes when their maximum sustained surface wind exceeds 110 miles per hour.
Republished June 12, 2014, to correct an error in the text.
Sunday, June 1, marked the beginning of the 2014 Atlantic hurricane season. The National Oceanic and Atmospheric Administration (NOAA) predicts a relatively inactive June-November hurricane season this year, following the quietest hurricane season in the past two decades in 2013. NOAA projects a 70% probability of 8-13 named storms this hurricane season, of which 3-6 will strengthen to hurricanes, with 1-2 becoming major hurricanes. Over the past 10 years (2004-13), the Atlantic hurricane season has averaged 16.3 named storms, 7.7 hurricanes, and 3.2 major hurricanes.
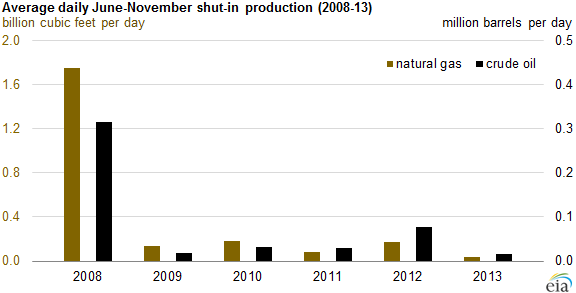
The effects that named storms this year in the Atlantic will have on Gulf Coast crude oil and natural gas production will depend on their trajectory and strength. Last year, only one named storm—Tropical Storm Andrea—made landfall in the United States, and it did not cause any disruptions to crude oil or natural gas production. The U.S. Department of Interior Bureau of Safety and Environmental Enforcement (BSEE) reported only one instance of shut-in oil and natural gas production last year, during Tropical Storm Karen in October. The last year that the United States experienced significant shut-ins was 2008, when two significant hurricanes affected oil and natural gas production: Hurricane Gustav, which made landfall in Cocodrie, Louisiana, on September 1, and Hurricane Ike, which made landfall in Galveston, Texas, on September 13.
The effect of hurricanes on oil and natural gas production has been reduced in part by an increasing portion of U.S. production coming from inland basins such as the Bakken Shale play in North Dakota and Montana's Williston Basin, and the Marcellus Shale play in the Appalachian Basin.
EIA's June 2014 Short-Term Energy Outlook (STEO, to be released on June 10) will project natural gas production factoring in an expected decrease from Gulf Coast hurricane and tropical storm shut-ins, based on NOAA's Atlantic hurricane outlook. In the event of a more active hurricane season, greater production decreases could have a noticeable effect on markets. Natural gas inventories enter the 2014 hurricane season at an 11-year low, following record-high storage withdrawals this past winter. The May STEO forecasts an average weekly storage injection of 88 billion cubic feet (Bcf) from now through the end of October to reach a prewinter gas inventory level of 3,405 Bcf. Although this would be a record storage build, the United States would start the 2014-15 winter season with working natural gas inventories that are well below the end-of-October storage levels over the past five years.
EIA plans to issue an analytic report on the 2014 hurricane season in conjunction with the STEO scheduled for release on June 10. EIA also continues to provide real-time storm tracking information through the mapping interface on its website that allows users to track storm trajectory and energy infrastructure.
Principal contributor: Michael Ford