U.S. Energy Information Administration logo
Skip to sub-navigation
‹ Analysis & Projections

Short-Term Energy Outlook

Release Date: October 6, 2026  |  Forecast Completed: October 1, 2026  |  Next Release Date: November 10, 2026  |  Full Report    |   Text Only   |   All Tables   |   All Figures

Global oil markets

Global oil prices
The Brent crude oil spot price increased to an average of $114 per barrel (b) in September, $23/b higher than in August. Prices rose following increased attacks on oil infrastructure and tankers around the Middle East. The most notable among these developments were attacks on Saudi Arabia’s East-West oil pipeline, which temporarily halted flows on a crucial bypass used to circumvent the Strait of Hormuz. Before the attacks, we estimate this pipeline was shipping more than 5.0 million barrels per day (b/d) of oil exports via Saudi Arabia’s Yanbu port on the Red Sea. The disruption of the pipeline led to the daily Brent spot price reaching as high as $131/b on September 15, as buyers scrambled to secure near-term supplies due to the loss of Saudi exports.

Daily prices eased somewhat during the last week of September as the East-West pipeline in Saudi Arabia was repaired and partially resumed flows as of September 22. Some of the decrease in Red Sea exports has been offset by shifting exports back through the Strait of Hormuz. Ship tracking data from Vortexa indicates that oil shipments through the Strait of Hormuz increased slightly in September as Saudi Arabia increasingly used ship-to-ship transfers along Oman’s coast.

We estimate that oil exports from the Middle East increased in September compared with August despite the increase in attacks, and we estimate that crude oil production shut-ins fell. We assess that crude oil production shut-ins averaged 4.8 million b/d in September, down from 5.8 million b/d in August and down from 10.9 million b/d at the peak in May.
Estimated Strait of Hormuz closure-related disruptions in crude oil production

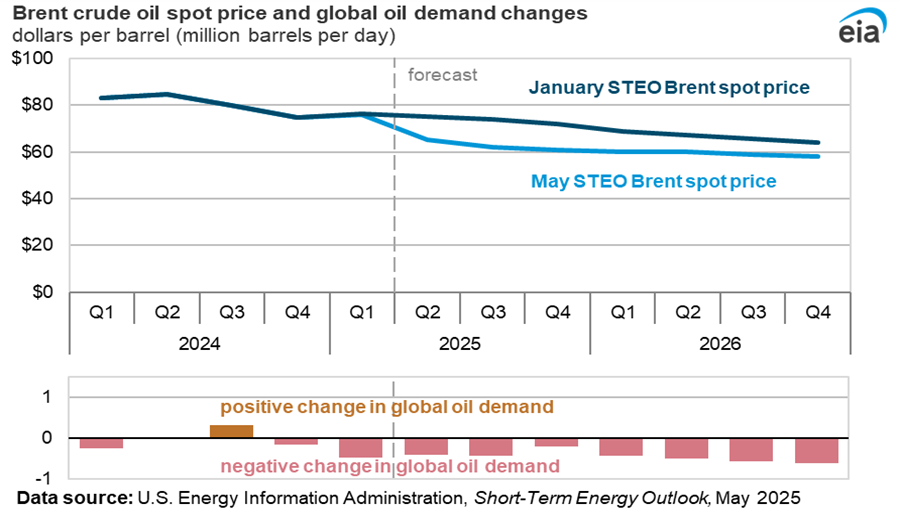
We forecast the Brent crude oil spot price will average $105/b in the fourth quarter of 2026 (4Q26), $14/b higher than in last month’s STEO. We assume that oil flows from the Middle East remain constrained through 4Q26, leading to shut-in production averaging 4.5 million b/d during that quarter. With export routes still constrained, the attacks on the East-West pipeline highlight the potential for continued volatility in physical oil flows and oil prices amid ongoing withdrawals from oil inventories. The heightened risk associated with oil tankers transiting the region has added to shipping costs and increased the risk premium reflected in oil prices. High tanker rates, which reached record levels in September, reflect increasing insurance costs and are putting additional upward pressure on delivered crude oil prices to refiners. Ships are also taking longer routes to avoid conflict zones, which is limiting the number of available vessels.
Brent crude oil spot price and global inventory changes

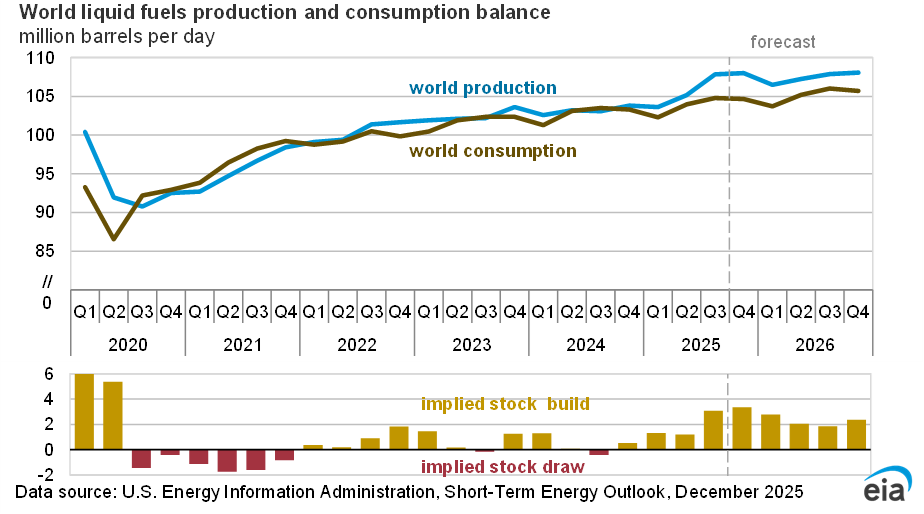
With continued disruptions of crude oil production and high transportation costs and risk premiums, we forecast that oil prices will remain elevated until constraints on oil flows from the Middle East resolve and oil inventories can be replenished. We estimate that global oil inventories fell by an average of 1.9 million b/d in 3Q26 and will fall an additional 0.7 million b/d on average in 4Q26.

Although we raised our crude oil price forecast from last month, we still expect oil prices will generally fall from their early October average. We assume that the combination of workarounds to export oil from the Middle East (such as pipeline and overland bypass routes, the use of ship-to-ship transfers, and new bypass pipeline capacity expected to come online in 2027 in the United Arab Emirates) will help shut-in volumes gradually fall through the STEO forecast period. We expect the majority of production in the region to return to pre-conflict averages by the end of 2Q27, and we forecast the Brent spot price decreases to an average of $87/b by 2Q27. As depleted global oil inventories build throughout next year, oil prices gradually fall to an average of $74/b in 4Q27. However, we expect the conflict in the Middle East will lead to continued volatility in crude oil flows both through the Strait of Hormuz and through alternative routes, which will likely lead to more volatility in short-term price movements than our forecast indicates.
Global Petroleum and Other Liquids
  2024202520262027

Brent crude oil spot price
(dollars per barrel)
81699684
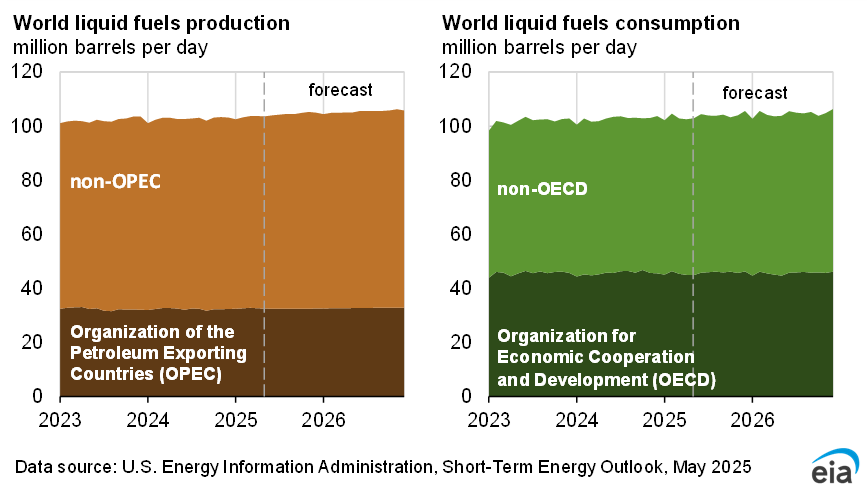
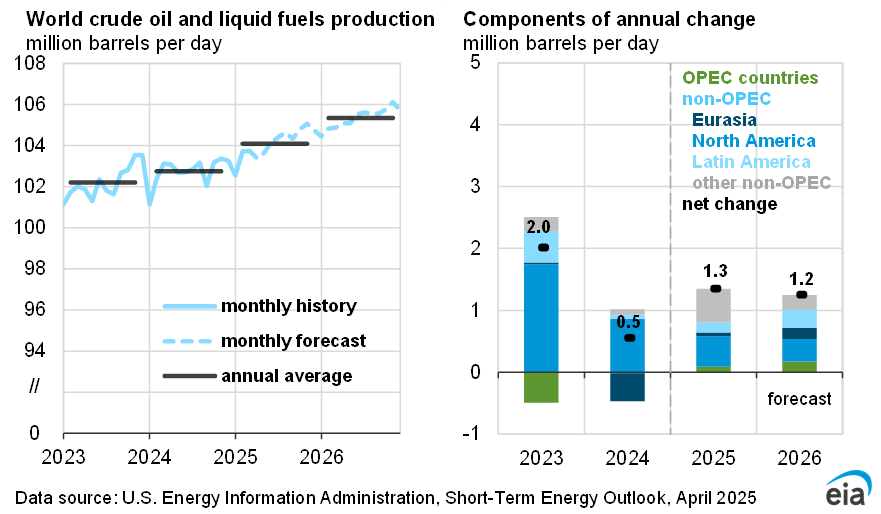
Global liquid fuels production
(million barrels per day)
103.2106.3101.1109.6
OPEC liquid fuels production
(million barrels per day)
28.429.323.929.2
Non-OPEC liquid fuels production
(million barrels per day)
74.777.077.280.4
Global liquid fuels consumption
(million barrels per day)
103.1104.4102.4104.6
Global GDP
(percentage change)
3.43.43.13.2

Interactive Data Viewers

Provides custom data views of historical and forecast data

STEO Data browser ›
Real Prices Viewer ›

Related Figures
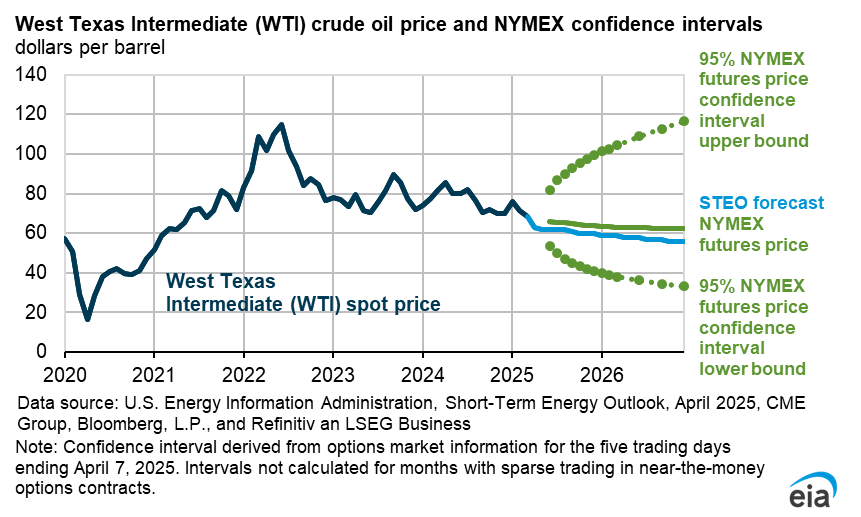
West Texas Intermediate (WTI) crude oil price XLSX PNG
World liquid fuels production and consumption balance XLSX PNG
World liquid fuels production and consumption XLSX PNG
World crude oil and liquid fuels production XLSX PNG
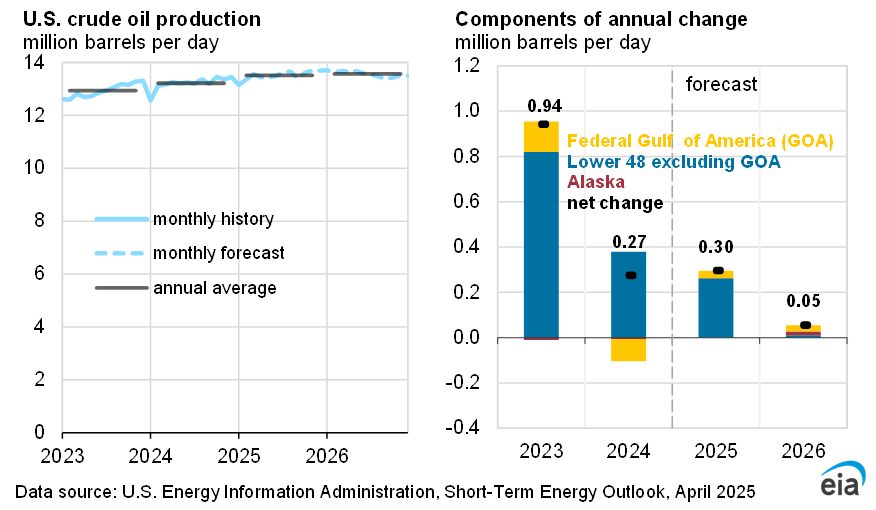
U.S. crude oil production XLSX PNG
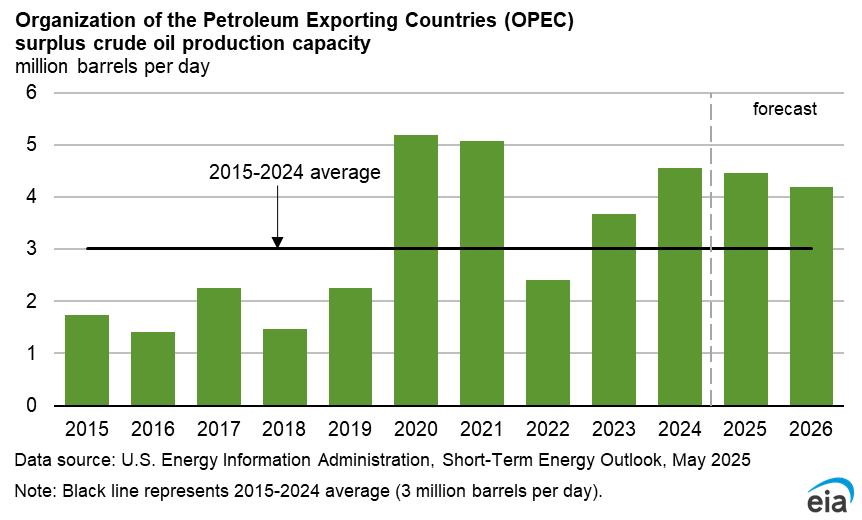
OPEC surplus crude oil production capacity XLSX PNG
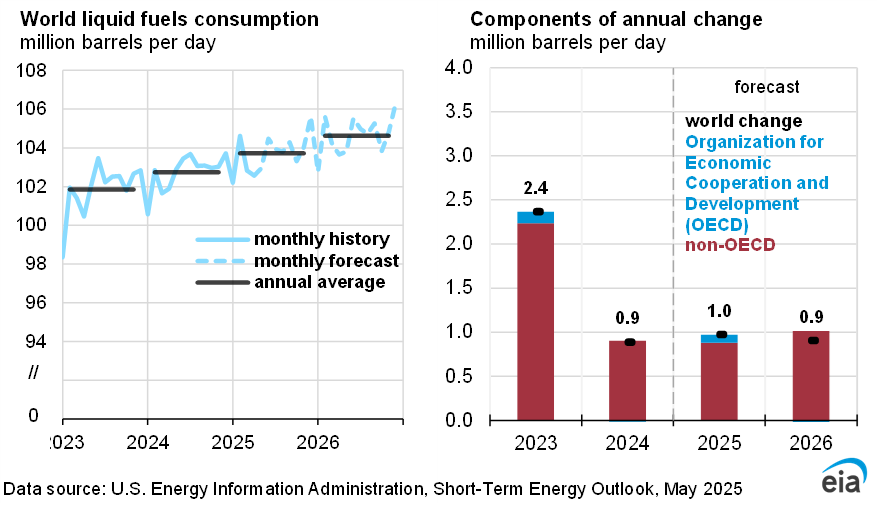
World liquid fuels consumption XLSX PNG
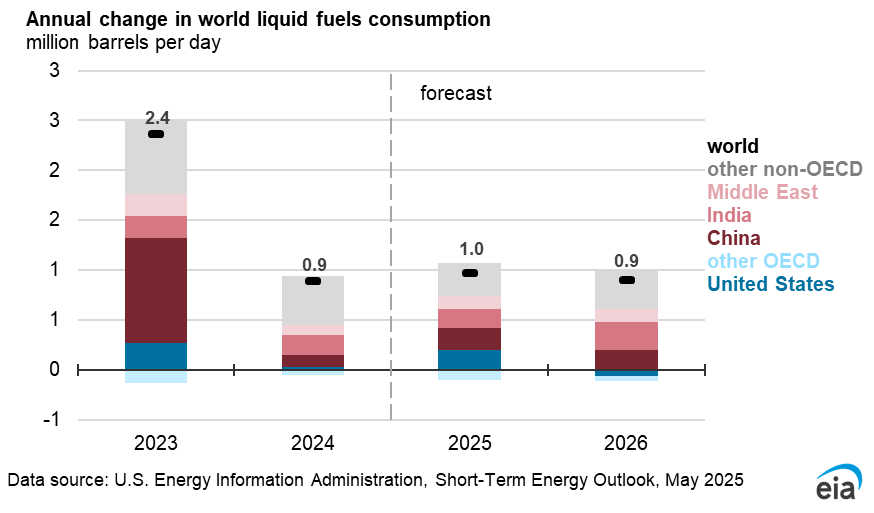
World liquid fuels consumption growth XLSX PNG
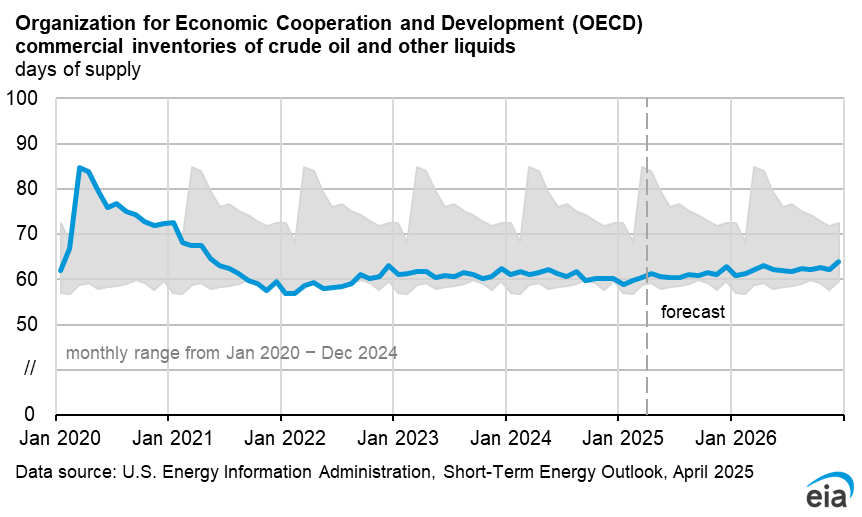
OECD commercial inventories of crude oil and other liquids (days of supply) XLSX PNG
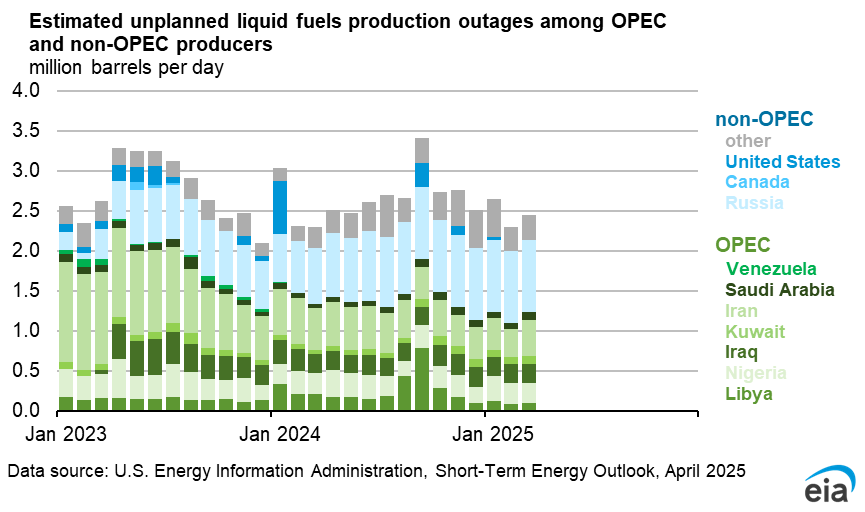
Estimated unplanned crude oil production outages among OPEC and non-OPEC producers XLSX PNG
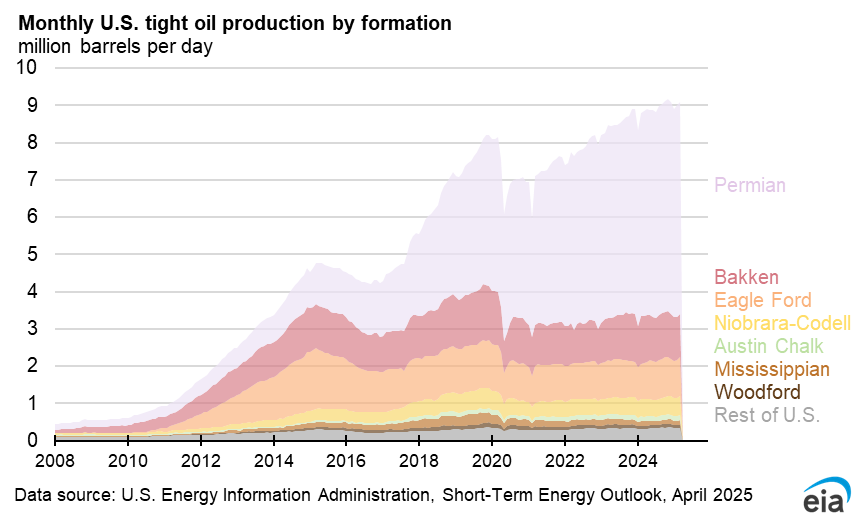
Monthly U.S. tight oil production by formation XLSX PNG
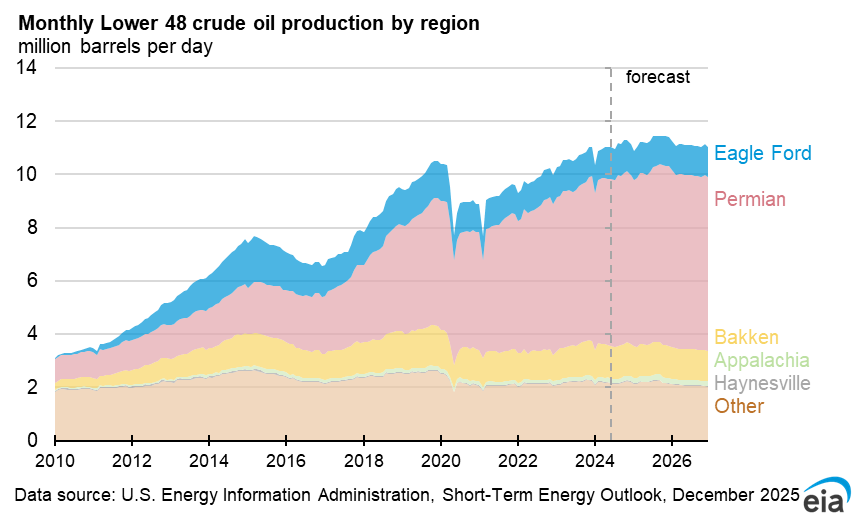
Monthly U.S. crude oil production by region XLSX PNG

Other Resources

WTI crude oil probabilities
(Microsoft Excel file)

Energy Price Volatility and Forecast Uncertainty documentation
(Adobe PDF file)

West Texas Intermediate crude oil price and NYMEX 95% confidence intervals
January 2023 - Current Month
(Adobe PDF file)
January 2021 - December 2022
(Adobe PDF file)
January 2019 - December 2020
(Adobe PDF file)
January 2017 - December 2018
(Adobe PDF file)
January 2015 - December 2016
(Adobe PDF file)
January 2013 - December 2014
(Adobe PDF file)
January 2011 - December 2012
(Adobe PDF file)
January 2009 - December 2010
(Adobe PDF file)
January 2007 - December 2008
(Adobe PDF file)

Statistics
Analysis
Tools
Education
News

Petroleum & Other Liquids

Crude oil, gasoline, heating oil, diesel, propane, and other liquids including biofuels and natural gas liquids.

Natural Gas

Exploration and reserves, storage, imports and exports, production, prices, sales.

Electricity

Sales, revenue and prices, power plants, fuel use, stocks, generation, trade, demand & emissions.

Coal

Reserves, production, prices, employment and productivity, distribution, stocks, imports and exports.

Nuclear & Uranium

Uranium fuel, nuclear reactors, generation, spent fuel.

Renewable & Alternative Fuels

Includes hydropower, solar, wind, geothermal, biomass and ethanol.

EIA Survey Forms

Forms EIA uses to collect energy data including descriptions, links to survey instructions, and additional information.

Total Energy

Comprehensive data summaries, comparisons, analysis, and projections integrated across all energy sources.

U.S. States

State energy information, including overviews, rankings, data, and analyses.

International

International energy information, including overviews, rankings, data, and analyses.

Environment

Greenhouse gas data, voluntary reporting, electric power plant emissions.

Data Tools, Apps, & Maps

Tools to customize searches, view specific data sets, study detailed documentation, and access time-series data.

Open Data

EIA's free and open data available as API, Excel add-in, bulk files, and widgets

EIA Beta

Come test out some of the products still in development and let us know what you think!

Open Source Code

EIA's open source code, available on GitHub.

RSS Feeds

Subscribe to feeds for updates on EIA products including Today in Energy and What's New.