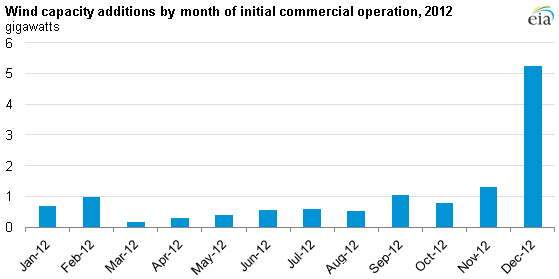
Wind industry installs almost 5,300 MW of capacity in December
Note: Data are preliminary.
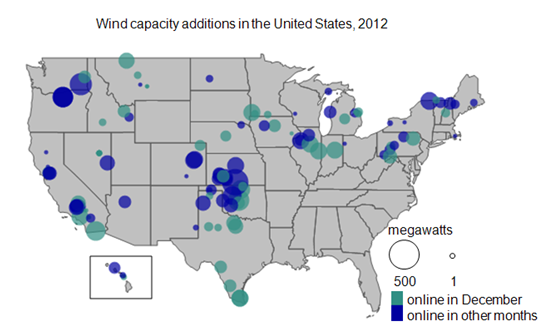
Approximately 40% of the total 2012 wind capacity additions (12,620 MW) came online in December, just before the scheduled expiration of the wind production tax credit (PTC). During December 2012, 59 new wind projects totaling 5,253 MW began commercial operation, the largest-ever single-month capacity increase for U.S. wind energy. About 50% of the total December wind capacity additions were installed in three states: Texas (1,120MW), Oklahoma (794 MW), and California (730 MW).
Wind plant developers reported throughout 2012 increasing amounts of new capacity scheduled to enter commercial operation before the end of the year. To qualify for the PTC last year, wind projects had to begin commercial operation by December 31.
On New Year's Day, Congress enacted a one-year extension of the PTC and also relaxed the rules. Under this extension, projects that begin construction before the end of 2013 are eligible to receive a 2.2 ¢/kWh PTC for generation over a 10-year period.
Note: Data are preliminary.
For 2012 as a whole, the four leading states for wind capacity installations were California (1,789 MW), Kansas (1,447 MW), Texas (1,504 MW), and Oklahoma (1,382 MW). Wind turbines installed during 2012 were concentrated in the midwestern and southern Great Plains regions. These are regions with high-potential wind resources, low population density (thus reducing problems related to siting and permitting), and existing and planned transmission lines to carry wind power to where the electricity is needed.
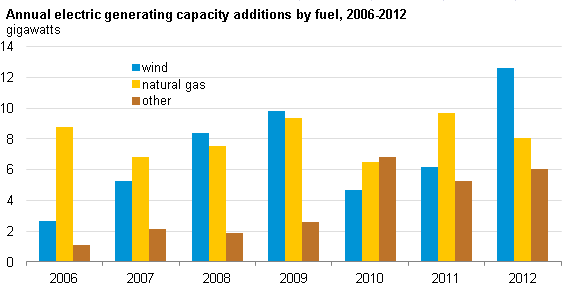
Wind generators provided the largest share of additions to total U.S. electric generation capacity in 2012, just as it did in 2008 and 2009. The 2012 addition of 12,620 MW is the highest annual wind capacity installment ever reported to EIA. Wind capacity additions accounted for more than 45% of total 2012 capacity additions and exceeded capacity additions from any other fuel source, including natural gas (which led capacity additions in 2000-07, 2010, and 2011).
Of all existing capacity at the end of 2012, wind made up 5.4%. However, wind provided only 3.4% of total electricity generation between January and November 2012 (the latest available data), reflecting a capacity utilization rate that is limited by the intermittent nature of the wind resource.
Note: The 2006-11 data are final; 2012 data are preliminary.
Detailed data on generator additions and retirements are available in the Electric Power Monthly (in tables ES3 and ES4, respectively). These data are preliminary survey results as of the end of January 2013 and will be updated.
Tags: capacity, electricity, policy, power plants, states, taxes, wind