Planned wind turbine additions rise in advance of scheduled expiration of wind tax credit
Many wind projects are planning to come on line before the end of 2012, in advance of the possible expiration of a federal incentive, the wind production tax credit (PTC). It appears that wind developers are pushing to complete projects in 2012 to qualify for the PTC. Under current law, projects that begin operating prior to the end of 2012 are eligible to receive a 2.2-cent PTC for each kilowatthour of generation over a 10-year period. Similar behavior in the face of previous PTC expirations was discussed in an earlier Today in Energy article describing the history of the wind PTC.
EIA collects monthly updates on modifications, retirements, and additions to the nation's fleet of power plants, including the planned date of commercial operation for new generators.
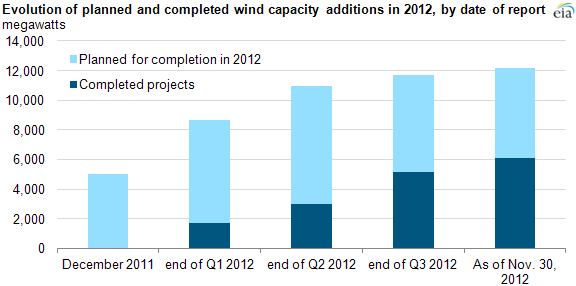
Wind plant developers reported increasing amounts of new capacity scheduled to enter commercial operation in 2012 as the year progressed. Even as completed projects accumulated during 2012 (see chart, dark blue bars), the amount of capacity expected to come on line before the end of the year continued to increase (light blue bars plus dark blue bars). As of November 30, 2012, the wind capacity planned to come on line by the end of December would account for approximately half of the total 2012 wind capacity additions.
Wind generators accounted for a significant portion of capacity additions since 2007 (see chart below), and were the largest source for generating capacity additions in 2008 and 2009. If all planned wind generators for 2012 come on line, as reported by industry participants, wind capacity additions could top 12,000 MW for this year. This would account for 45% of total additions and exceed capacity additions from any other fuel source, including natural gas, which was the leading fuel source for electric generating capacity additions in 2010 and 2011.
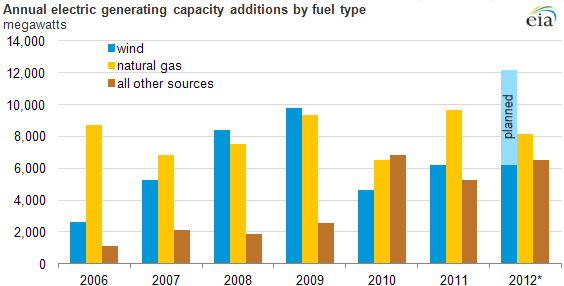
*Note: 2012 data include both completed and planned projects, with data as of November 30, 2012.
Detailed data on each generator addition and retirement are available in the Electric Power Monthly (in tables ES3 and ES4, respectively). These data represent responses to EIA's monthly update survey of existing electric generators. An annual survey will collect final data from all industry participants early next year.
Tags: capacity, electricity, policy, renewables, taxes, wind