
Drop in U.S. gasoline prices reflects decline in crude oil costs
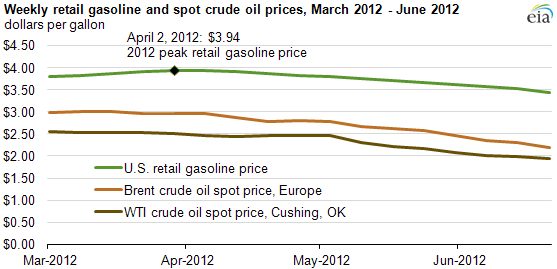
Note: The Brent and WTI crude oil spot prices are represented in dollars per gallon using a conversion factor of 42 gallons per barrel.
Since reaching a recent peak of $3.94 per gallon on April 2, the average retail price U.S. drivers paid for gasoline has fallen for 12 weeks in a row to $3.44 per gallon, according to EIA's weekly motor fuel survey. The drop in gasoline prices largely reflects the decline in crude oil prices (see chart above), which have historically comprised the biggest part of the pump price.
The national average price for regular unleaded gasoline fell 50 cents per gallon over the 12-week period, while the spot prices for West Texas Intermediate (WTI) crude oil declined the equivalent of 63 cents per gallon and Brent crude oil fell the equivalent of 81 cents per gallon. WTI and Brent are among the world's leading oil pricing benchmarks.
If crude oil price changes are fully passed through to consumers, for every $1 per barrel change in crude oil prices, consumers could expect to see a 2.4-cent-per-gallon change in retail gasoline prices. However, EIA analysis indicates that generally about 50% of the crude oil price change is usually passed on to consumers at the pump within two weeks, and 80% is generally passed on within four weeks. Gasoline prices are also sensitive to conditions affecting particular regional markets, such as significant refinery outages on the West Coast this spring that led to higher prices in that area.
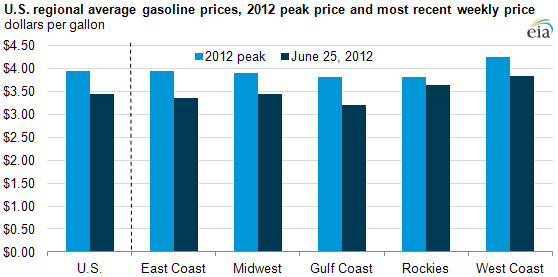
The price of crude oil accounts for about two-thirds of the retail price of gasoline. Refining costs, distribution and marketing costs, and state and federal taxes make up the rest of the retail gasoline price. Pump prices vary by region, with some drivers paying more or less for gasoline than the national average depending on where they live (see chart below).
Concerns that a weak global economy will lead to reduced petroleum demand has contributed to lower crude oil prices. However, part of the reason retail gasoline prices have not dropped as much as crude oil prices is that U.S. gasoline demand has started to show some growth in recent months. During the first quarter of 2012, monthly EIA data shows U.S. gasoline demand was down about 1.4% from the first quarter of last year. However, since the gasoline price peak, weekly EIA data indicate that gasoline demand has started to strengthen, with demand down only 0.9% in April compared to a year earlier and up by 0.2% in May.
The current 12-week drop in gasoline costs is the second-longest period of declining pump prices recorded by EIA's weekly fuel price survey since the drop at the end of 2008, when pump prices fell for 15 straight weeks.