
EIA’s weekly natural gas products provide timely natural gas information
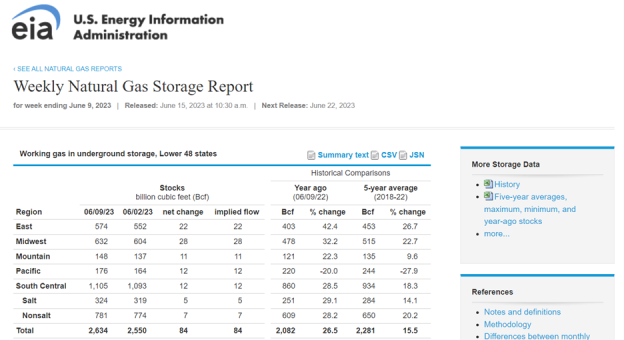
We provide daily and weekly information on natural gas market activity and drivers in three weekly products: the Weekly Natural Gas Storage Report, the Natural Gas Storage Dashboard, and the Natural Gas Weekly Update.
Natural gas is a significant source of energy for Americans, accounting for about one-third of total U.S. energy consumption last year. Natural gas is used to fuel power plants, to heat and provide hot water for homes and buildings, and as feedstock for industrial facilities and other uses.
Weekly Natural Gas Storage Report
The Weekly Natural Gas Storage Report (WNGSR) is the U.S. government’s only Principal Federal Economic Indicator that provides weekly data; other indicators report either monthly or quarterly data. WNGSR reports the underground working natural gas stock level as of the previous Friday, weekly net change, comparisons to historical levels and net changes, and statistical measures for each of five regions in the Lower 48 states. The five-region data series goes back to 2006.
WNGSR estimates, released on Thursday at 10:30 a.m. eastern time (except certain weeks with holidays), are based on our statistical survey of storage operators that covers about 95% of working natural gas storage capacity in each of the five regions.
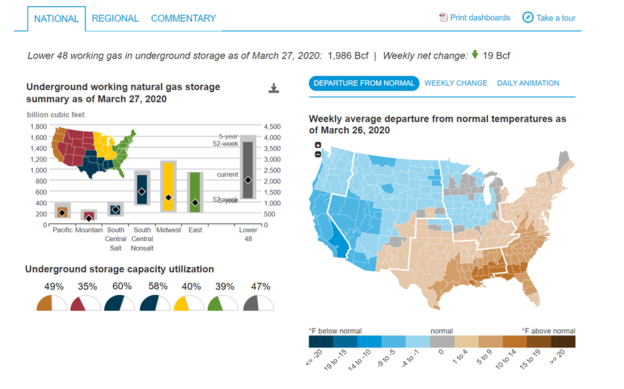
Natural Gas Storage Dashboard
The interactive dashboard enables users to select national or regional information, choose specific years or ranges, animate trends, and download selected data series or images. In addition to data visualizations, the commentary section provides analysis of recent natural gas storage-related market conditions.
Natural Gas Weekly Update
Our Natural Gas Weekly Update (NGWU) publishes a summary of recent natural gas market activity each Thursday afternoon. NGWU is headlined by a short article called In the News, which highlights a current natural gas-related issue or trend.
NGWU publishes graphs and tables with weekly and daily data using third-party information. These market indicators include spot and futures market prices, supply and consumption statistics, and liquefied natural gas (LNG) export volumes. NGWU also features third-party information on upstream gas activity such as rig counts and monthly shale gas production numbers by play. Our WNGSR values are also recapped in the NGWU.
So far this year, NGWU analyses have focused on a variety of topics, including winter natural gas consumption, natural gas use for power generation, natural gas storage and LNG developments abroad, natural gas infrastructure, and national and regional prices.
Principal contributor: Kristen Tsai
Tags: storage, natural gas, weekly