
Daily U.S. electricity generation from natural gas hit a record in mid-July
Note: We adjusted values for previous years to align weekdays and weekends.
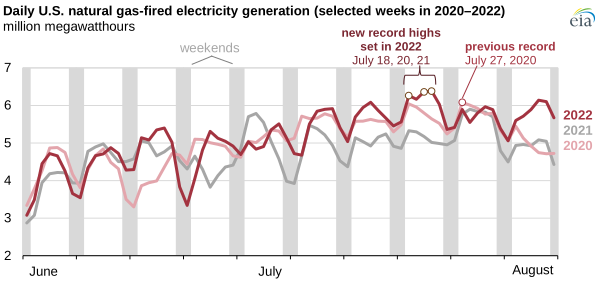
In the U.S. Lower 48 states, electric power generated by natural gas-fired power plants reached 6.37 million megawatthours on July 21, 2022, according to our Hourly Electric Grid Monitor. Despite relatively high natural gas prices, demand for natural gas for electricity generation has been strong throughout July as a result of above-normal temperatures, reduced coal-fired electricity generation, and recent natural gas-fired capacity additions.
U.S. electricity demand usually peaks in the summer because of demand for air conditioning. This past July was especially hot, ranking as the third hottest on record in the United States. Before this year, the previous daily peak for natural gas-fired electricity generation had occurred on July 27, 2020, when natural gas prices were historically low.
In July 2020, the Henry Hub natural gas price averaged $1.77 per million British thermal units (MMBtu). This July, the natural gas price averaged $7.28/MMBtu. Typically, higher natural gas prices reduce natural gas price competitiveness relative to other sources, especially coal.
This summer, coal-fired power plants have not been used as much as in prior summers. Continued retirements of coal-fired generating plants, relatively high coal prices, and lower-than-average coal stocks at power plants have limited coal consumption. In May, coal inventories at power plants averaged 20% lower than the prior-year levels.
New capacity has increased the availability and use of natural gas-fired electricity. Over the past 10 years, developers have added about 62 gigawatts of combined-cycle gas turbine capacity. The increased number of combined-cycle gas turbines in use has led to efficiency gains and less conversion losses, which means more electricity can be generated from the same amount of natural gas.
Principal contributors: Kirby Lawrence, Max Ober
Tags: generation, electricity, natural gas