More than 60% of energy used for electricity generation is lost in conversion
Note: Click for full U.S. electricity flow 2019 diagram.
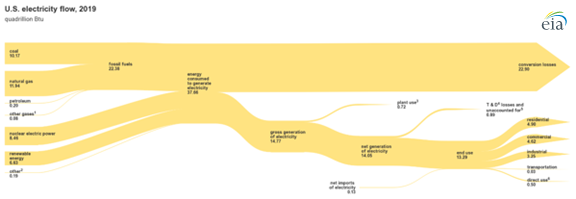
In 2019, U.S. utility-scale generation facilities consumed 38 quadrillion British thermal units (quads) of energy to provide 14 quads of electricity. Most of the difference between these values was lost as an inherent result of the energy conversion process. The U.S. Energy Information Administration’s (EIA) U.S. electricity flow diagram visualizes U.S. electricity flow from energy sources consumed to generate electricity and electricity net imports to disposition (conversion and other losses, plant use, and end-use consumption).

Electricity is a secondary energy source that is produced when primary energy sources (for example, natural gas, coal, wind) are converted into electric power. When energy is transformed from one form to another and moved from one place to another, some of the input energy is lost in the process. Some input energy is lost during electricity generation as well as other processes such as when vehicles burn gasoline.
The technology and the type of fuel used to generate electricity affect the efficiency of power plants. For example, in 2019, of the 11.9 quads of natural gas consumed for electricity generation, natural gas plants converted 45% (5.4 quads) into net generation of electricity. By contrast, of the 10.2 quads of coal consumption, coal plants converted 32% (3.3 quads) into net generation.
The difference in conversion rates is because coal-fired generation plants in the United States are often older and less efficient than many natural gas-fired plants. In U.S. power plants, generating a kilowatthour of electricity from coal requires on average about one-third more energy than producing a kilowatthour from natural gas. Although more electricity was generated by natural gas than by coal in 2016, it was not until 2019 that more natural gas was used to generate electricity than coal.
In recent decades, the U.S. electric power grid’s fuel mix has shifted from mostly coal to a more diverse selection of fuels, including natural gas and renewable energy. In particular, the shift toward newer, more efficient natural gas-fired power plants with combined-cycle generators has resulted in an increase in the average efficiency of fossil fuel-fired electric power plants and in lower levels of overall conversion losses. EIA calculates total primary energy consumption for noncombustible renewable electricity sources, such as hydroelectricity, wind, and solar, by applying a fossil fuel equivalency factor.

In terms of end use, nearly all (96%) of the 13.3 quads of electricity used in the United States during 2019 was delivered as retail sales to four end-use sectors (residential, commercial, industrial, and transportation). The remaining 4% was used directly by facilities in the commercial and industrial sectors. The residential and commercial sectors accounted for nearly 75% of electricity retail sales in 2019.
You can find electricity data in a number of EIA sources, including
- Electricity data browser, an interactive data browser containing nearly all of EIA’s electricity-related data series
- Monthly and annual electricity reports, which compile information from EIA’s electricity industry surveys
- Monthly Energy Review, EIA’s comprehensive source for historical energy data
Principal contributor: Bill Sanchez