
U.S. coal-fired electricity generation in 2019 falls to 42-year low
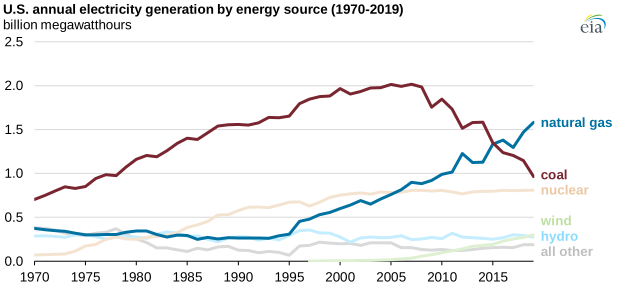
Output from the U.S. coal-fired generating fleet dropped to 966,000 gigawatthours (GWh) in 2019, the lowest level since 1976. The decline in last year’s coal generation levels was the largest percentage decline in history (16%) and second-largest in absolute terms (240,000 GWh).
Although lower electricity demand in 2019 was partly responsible for less coal-fired generation, the primary driver was increased output from natural gas-fired plants and wind turbines. Natural gas-fired generation reached an all-time record of nearly 1.6 million GWh in 2019, up 8% from 2018. Electricity generation from wind turbines also set a new record, surpassing 300,000 GWh, up 10% from 2018.
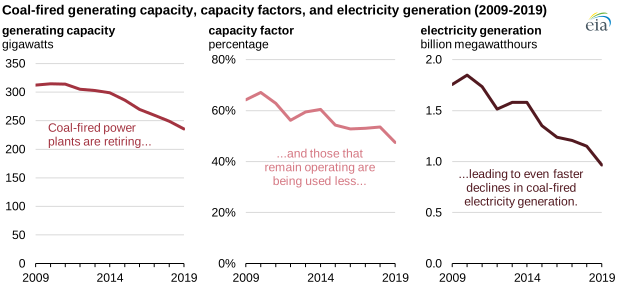
U.S. coal-fired capacity peaked at 318 gigawatts (GW) in 2011 and has been declining since then because many plants retired or switched to other fuels and few new coal-fired plants came online. By the end of 2019, U.S. coal-generating capacity totaled 229 GW.
The coal fleet’s rate of operation, or utilization, has also decreased. The U.S. coal fleet generated as much as 67% of its capacity in 2010, based on the operating capacity at the time. Coal’s utilization rate has declined since then, and in 2019, it fell to 48%.
Falling coal plant utilization rates have occurred at the same time as increased generation from competing sources. In particular, natural gas combined-cycle turbine (CCGT) plants ran at 57% of capacity in 2019 versus less than 50% of capacity for coal.
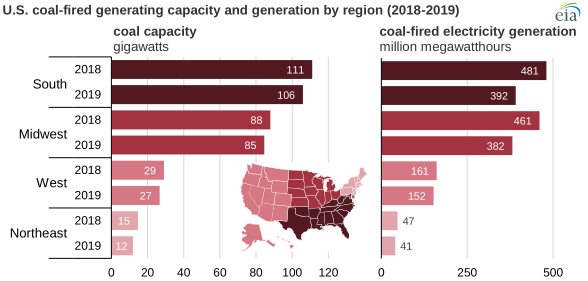
Coal-fired generation has decreased across the United States. Although some areas in the Midwest and West witnessed fewer coal plant retirements and more stable operation, every region recorded substantial declines in generation in 2019. The Southeast, East North Central, and West South Central regions, which have large coal capacities, each had reductions of more than 18% in coal-fired generation.
The increased availability of low-priced natural gas has been the biggest factor in decreasing coal-fired generation. Highly efficient CCGT plants burning relatively low-cost natural gas have reduced the amount of time a coal plant is called on to dispatch power into the grid. This factor has lowered average coal plant utilization rates and pushed some coal plants into early retirement.
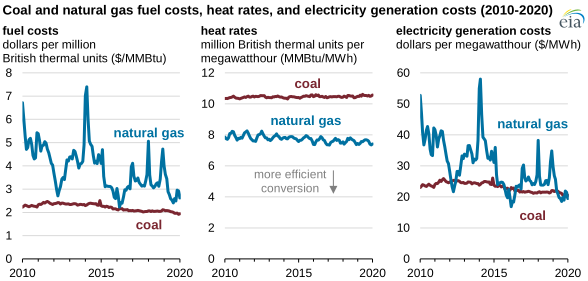
Average delivered prices for coal at power plants have been declining. Through 2015, the cost of coal averaged $2.25 per million British thermal units (MMBtu) before falling to less than $2.00/MMBtu in late 2019.
Although coal at U.S. power plants has cost less than natural gas, for coal to be competitive, its delivered cost must be at least 30% lower to make up for the differences in efficiency between a typical coal-fired plant and a typical natural gas-fired plant. These differences are even larger for more efficient natural gas-fired combined-cycle plants. Coal plants must also offset higher costs for emission control equipment and other operations.
Principal contributor: Mark Morey
Tags: generation, coal, electricity