WTI discount to Brent and premium to Bakken both rising in early 2012
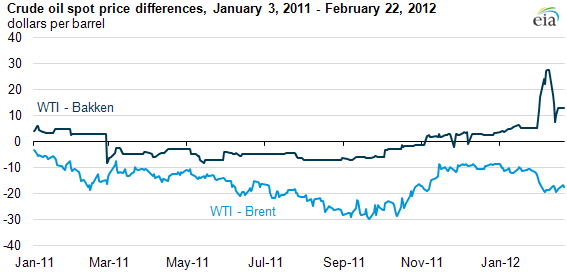
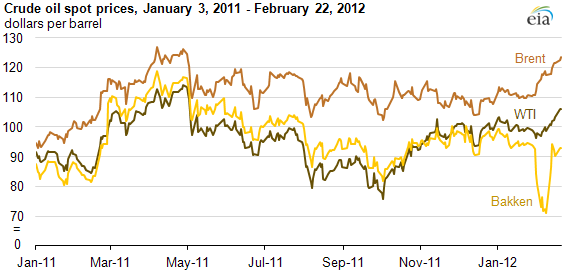
The price difference between West Texas Intermediate (WTI) crude oil and Brent crude oil has widened in 2012 (see chart above). In February, WTI's discount to Brent has averaged $18 per barrel after averaging $11 per barrel from November 2011 through January 2012. Further north in the United States, the price for Bakken crude oil recently moved to a historically-wide discount compared to WTI.
On February 10, the discount for Bakken crude oil reached a record $28 per barrel compared to WTI (see chart below). While this difference has narrowed recently, it was still at $13 per barrel as of February 22, which is high compared to historical levels. It is likely that concerns regarding oil transportation bottlenecks throughout the central United States and increasing production from shale formations in the northern United States are driving these price trends.
On average in 2011, WTI sold for about $16 per barrel less than Brent due to transportation bottlenecks. This price difference reached as high as $30 per barrel in September 2011. Towards the end of last year, with the news of the coming reversal of the Seaway pipeline, among other factors, the WTI discount to Brent and its competing grades such as Louisiana Light Sweet (LLS) narrowed.
However, last month the owners of the Seaway pipeline announced the expected reversal of the line would not be completed until June 1, two months later than previously announced. The announcement reintroduced concerns that markets in Cushing, Oklahoma—the trading hub for WTI—could see transportation bottlenecks to the refineries on the Gulf Coast persist longer than expected. This expectation has depressed the price of WTI relative to other crudes.
This price divergence is different than the one present through most of 2011. Unlike 2011, when Bakken crude oil traded within a few dollars of WTI, Bakken has traded at record discounts to WTI so far in 2012. When WTI and Bakken traded at similar levels, which were heavily discounted to Brent and LLS, it implied that the market viewed transportation issues between North Dakota/Canada and Cushing equally with those transportation issues between Cushing and the Gulf Coast.
However, with the amount of liquids-directed drilling occurring in the Bakken region, there has been a significant increase in the supply of Bakken crude. The Bakken crude price discount is an indication that production is likely proceeding faster than existing and new infrastructure can efficiently bring it to market, leading to transportation congestion issues in the northern Midwest that are more severe than those around Cushing.