2011 Brief: Brent crude oil averages over $100 per barrel in 2011
Note: Brent is the underlying crude oil for the light sweet crude oil futures contracts on the Intercontinental Exchange (ICE). West Texas Intermediate (WTI) represents the spot price for crude oil at Cushing, Oklahoma, the physical delivery hub for NYMEX light sweet crude oil futures contracts.
This article continues a series of briefs on energy market trends in 2011.
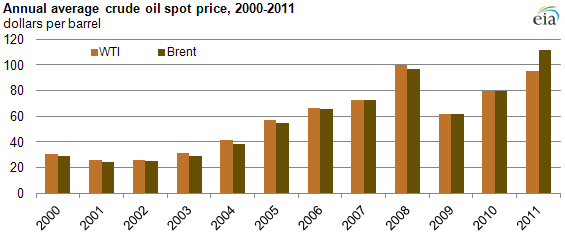
The crude oil markets sustained high price levels in 2011, as the spot price of Brent averaged $111.26 per barrel, marking the first time the global benchmark averaged more than $100 per barrel for a year (see chart above). The West Texas Intermediate (WTI) crude oil price averaged $94.87 per barrel, up $15 per barrel from 2010, reflecting a discount to the Brent crude oil price due to transportation bottlenecks near Cushing, Oklahoma, the physical delivery hub for NYMEX light sweet crude oil futures contracts.
The price increases in 2011 reflected tightness in the global crude oil market that began in 2010 and marked the highest crude oil prices since 2008. Key factors affecting crude prices in 2011 included:
- Arab Spring. The Arab Spring and the civil war in Libya roiled oil markets during the first half of the year. Prices quickly escalated when protests in Libya intensified in late February. The spot price of Brent increased $15 per barrel from February 18 to March 2 as the market coped with the loss of 1.5 million barrels per day (bbl/d) of exports from Libya. With low spare production capacity, this sudden supply loss challenged the ability of the Organization of the Petroleum Exporting Countries (OPEC) producers to provide incremental supplies to an already tight market.
- Demand. Demand growth in emerging markets, notably China and the Middle East, drove crude oil prices higher in 2011 as well. During the first six months of 2011, the demand for petroleum products in countries not part of the Organization for Economic Cooperation and Development (non-OECD) grew by almost 4%, just as the market was coping with the loss of Libyan exports. Even with declining OECD country demand in 2011, overall global demand rose by 1.2% (1.1 million bbl/d).
- Transportation Bottlenecks. Brent's price strength in the first half of 2011 was not matched by WTI, which became dislocated from the global crude oil market due to transportation bottleneck issues in the U.S. Midwest (see chart below). Amid fast-rising crude oil production from the Bakken Shale formation and Canadian oil sands, prices for U.S. inland crude benchmark WTI weakened relative to those of broadly traded coastal or imported crude oil grades, such as Brent or Louisiana Light Sweet (LLS). Brent's premium to WTI reached a record level of almost $30 per barrel in September 2011. Between October and November the premium fell almost $20 per barrel, most likely as a result of signs that transportation constraints out of the U.S. Midwest, the main market for WTI, were easing. However, the spread ended the year close to $10 per barrel, still wide by historical standards.
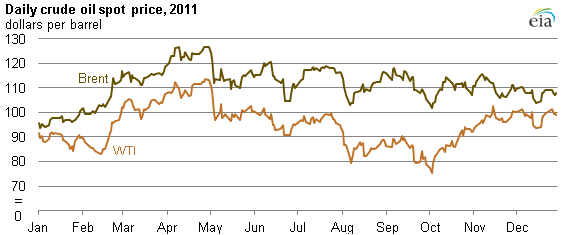
While WTI experienced a wide trading range in 2011, as its isolated market depressed the crude's value, Brent and other waterborne crudes maintained a fairly stable trading range anchored around $110 per barrel from May through the end of the year. Factors mitigating upward crude oil price pressure in 2011 included:
- Debt Crisis. The European debt crisis loomed large over the global economy, and expectations for economic growth globally, especially in the OECD economies, were not realized over the course of the year, resulting in lower-than-expected growth in demand for petroleum products.
- Strategic Petroleum Release. In response to the loss of Libyan supplies, the International Energy Agency's member countries collectively released stocks from their strategic petroleum reserves during the summer months.
- Supply Gains. Output increases from Saudi Arabia (OPEC's largest producer) and the return of Libyan oil production helped dampen price increases during the second half of the year.