
EIA expects U.S. natural gas inventories to enter winter heating season below average
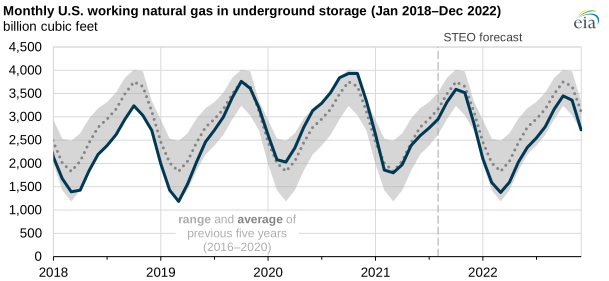
In our August 2021 Short-Term Energy Outlook (STEO), we forecast U.S. inventories of natural gas will reach 3,592 billion cubic feet (Bcf) by November 1, the beginning of the winter heating season. This amount is 159 Bcf below its previous five-year average (2016–2020). Above-average withdrawals of natural gas from storage in the 2020–2021 winter heating season and below-average injections into storage this summer contributed to our forecast of below-average inventories of natural gas, along with relatively flat dry natural gas production and high natural gas exports.
U.S. production of dry natural gas has remained relatively flat, averaging 91.5 billion cubic feet per day (Bcf/d) so far in 2021 (January–July), 0.4 Bcf/d below the same period in 2020. Production in January 2021 and July 2021 both averaged 92.5 Bcf/d. Production of natural gas declined in February 2021 by more than 6.5 Bcf/d because of extremely cold weather and well freeze-offs, but it increased to 92.0 Bcf/d the next month.
U.S. exports of liquefied natural gas (LNG) have reached record-high levels so far in 2021 due to newly added LNG export capacity and increases in international natural gas and LNG prices. In 2020, U.S. LNG exports averaged 6.5 Bcf/d during a time of low global natural gas demand following the onset of the COVID-19 pandemic. In contrast, U.S. LNG exports have averaged 9.4 Bcf/d so far this year, and we forecast that LNG exports will average 9.5 Bcf/d for the year as a whole. Pipeline exports of natural gas have also increased in 2021 compared with 2020. U.S. pipeline exports of natural gas have averaged 8.5 Bcf/d so far in 2021, compared with 7.9 Bcf/d in 2020. We forecast that U.S. pipeline exports of natural gas will average 8.8 Bcf/d for all of 2021.
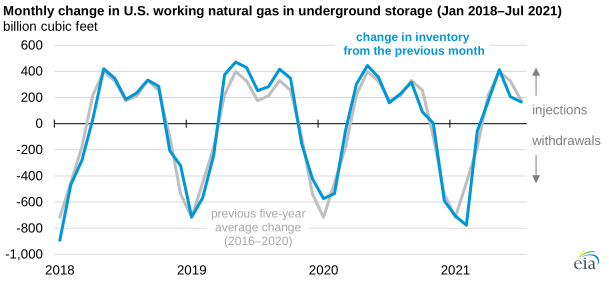
The high level of U.S. exports in 2021 combined with the relatively flat production has contributed to below-average injections of natural gas to storage this summer as we head into the winter heating season. So far this injection season (April 1–October 31), U.S. inventories of natural gas have grown by 960 Bcf, 14% less than the five-year average inventory build from April to July. In June 2021, the hottest June on record for the United States, natural gas inventories grew by 207 Bcf, 120 Bcf less than the five-year average inventory build for June. In May and June, U.S. consumption of natural gas increased 4.2 Bcf/d, or 6.2%, because of higher electric power sector consumption in response to the hot weather.
Principal contributors: Tim Hess, Corrina Ricker