
Last winter saw larger-than-average U.S. natural gas withdrawals from storage
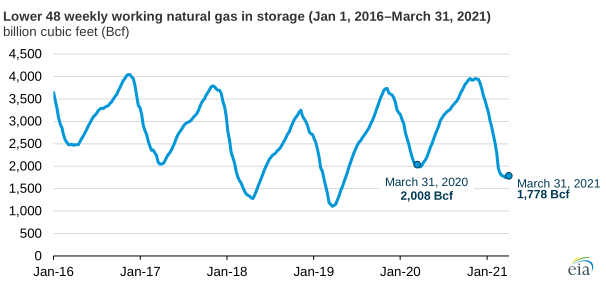
Note: Data for March 31, 2021, are an interpolated value, based on the Weekly Natural Gas Storage Report.
Significantly colder-than-normal temperatures in the Lower 48 states in late January through mid-February resulted in increased heating demand for natural gas in the United States, despite an otherwise warmer-than-normal winter. As a result, the winter had larger-than-average winter natural gas withdrawals. Before the cold snap, winter temperatures had been relatively mild, but a combination of increased heating demand, record liquefied natural gas (LNG) and pipeline exports, and decreased natural gas production contributed to the withdrawal activity during February.
Working natural gas in storage in the Lower 48 states as of March 31, 2021—the traditional end of the heating season that began November 1, 2020—totaled 1,778 billion cubic feet (Bcf), 1.4% less than the five-year (2016–20) average for the end of the heating season, according to EIA’s Weekly Natural Gas Storage Report released on April 8. Net withdrawals from working natural gas inventories during the 2020–21 heating season exceeded the five-year average by 10.6%.
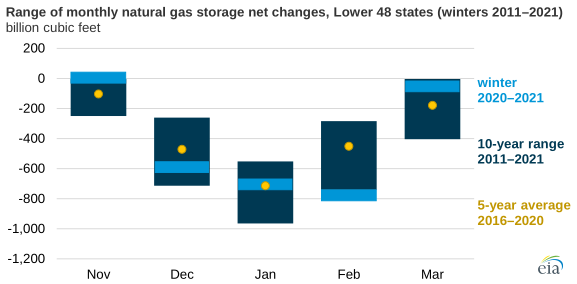
Note: Data for March 31, 2021, are an interpolated value, based on the Weekly Natural Gas Storage Report.
Monthly net withdrawals of natural gas in the Lower 48 states in February totaled 778 Bcf—the largest amount of natural gas withdrawn during February since 2011. The withdrawal exceeded the five-year February average by 328 Bcf. Net withdrawals from working natural gas during February accounted for 37% of all withdrawals from natural gas storage during the 2020–21 heating season, compared with 24% during the previous five heating seasons. A record amount of natural gas, 156 Bcf, was withdrawn during the week of February 19 in the South Central region, which includes Texas.
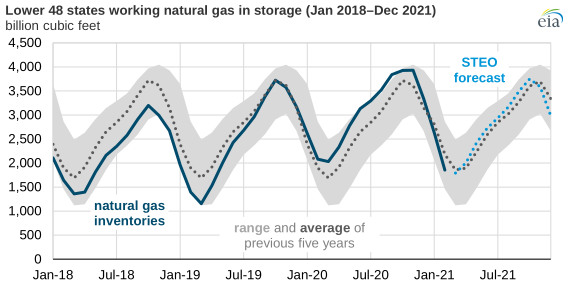
At the beginning of the U.S. heating season, natural gas in storage was 178 Bcf more than the average storage level of the previous five years. This surplus grew to 285 Bcf by the end of November amid mild temperatures. Increased heating demand during December and January narrowed the surplus, and extreme cold temperatures and rapid rate of withdrawals in February created the first deficit to the five-year average since November 2019.
Principal contributor: Jose Villar
Tags: storage, natural gas, weather