
U.S. sees largest weekly gasoline price increase since Hurricane Harvey
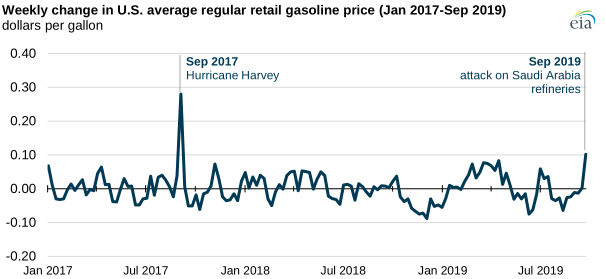
As of Monday, September 23, 2019, the U.S. average retail gasoline price increased by more than 10 cents per gallon (gal) from the previous Monday, based on data in the U.S. Energy Information Administration’s (EIA) Gasoline and Diesel Fuel Update. This weekly increase was the largest since early September 2017, when the national average gasoline price rose 28 cents/gal in the aftermath of Hurricane Harvey. EIA surveys retail gasoline and diesel fuel stations each Monday morning.
In its Gasoline and Diesel Fuel Update, EIA estimates that slightly more than half of the regular retail gasoline price in August 2019 was based on the price of crude oil. Other components, such as taxes (18% of the price) and distribution and marketing costs and profits (17%), tend to fluctuate less than refining costs and profits (12%) and crude oil prices (53%).
Gasoline prices in the United States tend to follow price movements of the global crude oil benchmark Brent. On Monday, September 16, the first full day of trading following the attack on Saudi Arabia’s key crude oil production and processing infrastructure that shut in 5.7 million b/d of crude oil production, Brent crude oil prices increased by $7.17 per barrel (b) from the previous trading day, September 14. Monday’s change was the largest single-day increase in Brent crude oil prices in the past decade. Since then, Brent prices have fallen, most recently to $64.66/b on September 24, or $3.76/b less than the price on September 16.
Because each barrel holds 42 gallons, each sustained $1/b change in the price of crude oil translates to upward pressure of 2.4 cents/gal in the price of gasoline. According to EIA analysis, about half of a crude oil price change passes through to retail gasoline prices within two weeks. About 80% of the crude oil price change passes through to gasoline prices within four weeks. The gasoline price pass-through tends to be more rapid when crude oil prices increase rather than when they decrease.
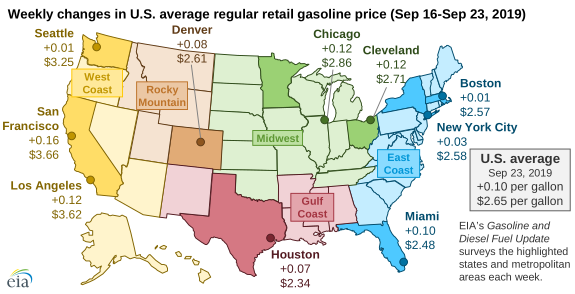
EIA’s weekly gasoline price survey collects data for several geographic regions: 10 U.S. metropolitan areas, 9 states, 5 U.S. regions (Petroleum Administration for Defense Districts), and 4 subdistricts. Regional gasoline price changes from September 16 to September 23 were highest in the Midwest, where prices increased nearly 13 cents/gal, and lowest in New England, where prices increased 1 cent/gal. Gasoline prices in the Gulf Coast, which typically has the lowest average gasoline price in the country, increased by 12 cents/gal.
Among the 10 metropolitan areas in EIA’s gasoline price survey, San Francisco, California gasoline prices increased the most, by 16 cents/gal to $3.66/gal. Gasoline prices increased by 12 cents/gal in Los Angeles, California; Chicago, Illinois; and Cleveland, Ohio. By comparison, gasoline prices in Boston, Massachusetts, were nearly unchanged at $2.57/gal, and gasoline prices in Seattle, Washington, increased by 1 cent/gal to $3.25/gal.
Principal contributor: Owen Comstock
Tags: prices, weather, gasoline, liquid fuels, oil/petroleum