
United States sets new daily record high for natural gas use in the power sector
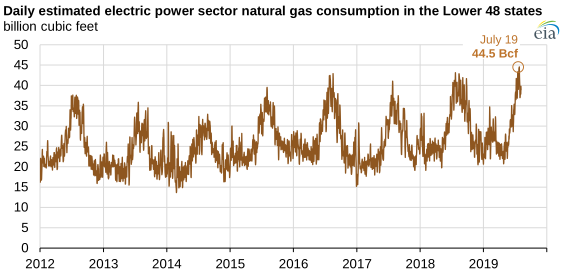
The United States likely set a new daily record on Friday, July 19, of 44.5 billion cubic feet (Bcf) for natural gas consumption by electric power plants, according to S&P Global Platts. U.S. power sector natural gas consumption exceeded the previous record of 43.1 Bcf—set on July 16, 2018—on five days in July. Higher-than-normal temperatures and relatively low natural gas prices contributed to increased natural gas consumption by electric generators.
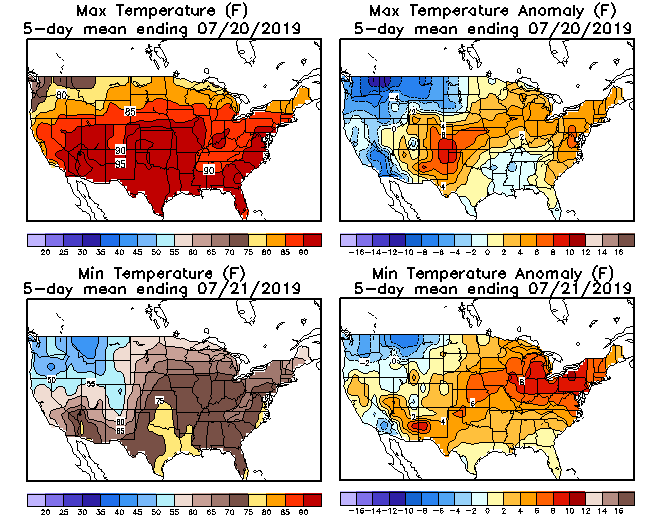
Higher electricity demand for air conditioning during a heat wave from July 15 through July 22 drove the increased power generation, especially from natural gas-fired generators. Although the highest temperatures occurred during the weekend, most states east of the Rocky Mountains experienced warmer-than-normal weather in the days leading up to the heat wave. From July 16 through July 21, the average maximum temperature exceeded 85°F in most parts of the country.
Relatively low natural gas prices have also led to higher natural gas-fired generation this summer. According to Natural Gas Intelligence, natural gas spot prices at the Henry Hub in Louisiana averaged $2.33 per million British thermal units (MMBtu) from July 16 through July 21. So far this summer (June 1–August 1), Henry Hub prices have averaged $2.31/MMBtu, 19% lower than during the same period last year.
Spot natural gas prices elsewhere in the country have been even lower than those at Henry Hub. Natural gas prices at the Chicago Citygate—the regional price benchmark for Midwestern states—have averaged 19¢/MMBtu lower than Henry Hub prices so far this summer. Regional spot prices in the Northeast (such as Dominion South in western Pennsylvania) have traded 30¢/MMBtu lower than Henry Hub.
In recent years, many natural gas-fired generators have come online throughout the country, especially in the PJM Interconnection, the regional transmission organization (RTO) responsible for managing wholesale electricity in 13 states and the District of Columbia.
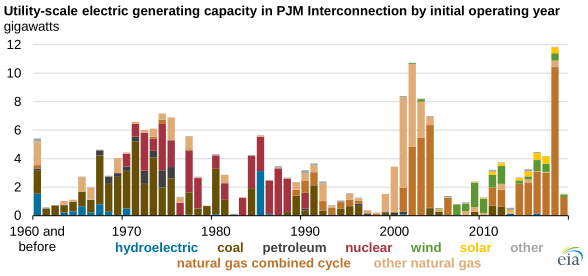
Based on data in the U.S. Energy Information Administration’s Preliminary Monthly Electric Generator Inventory, more than 12 gigawatts (GW) of new natural gas-fired electric generation capacity―primarily highly efficient combined-cycle units―have entered service in PJM since the beginning of 2018. The new capacity has increased total natural gas-fired capacity in the region by 17% and accounts for 55% of the total natural gas combined-cycle capacity added in the nation.
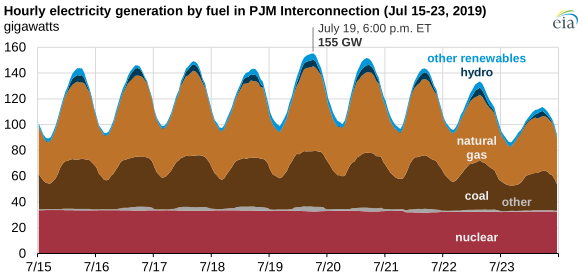
For the past few years, natural gas-fired power plants have been dispatched in PJM at higher levels during periods of increased demand. On July 19, in the hour ending 6:00 p.m. ET, PJM dispatched a total of 155 GW, 66 GW (or 43%) of which was met by natural gas-fired generators. In comparison, 43 GW of coal-fired generation capacity, the second-highest fuel source on that day, was dispatched in that hour.
Principal contributor: Katie Dyl