
U.S. natural gas-fired combined-cycle capacity surpasses coal-fired capacity
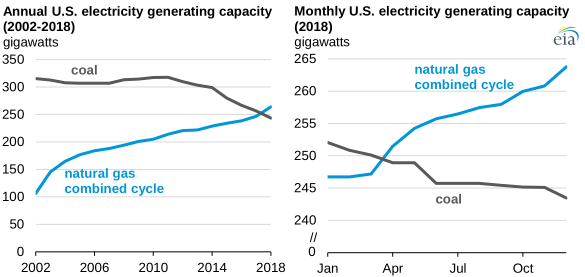
The amount of generating capacity from natural gas-fired combined-cycle (NGCC) plants has grown steadily over time, and in 2018, surpassed coal-fired plants as the technology with the most electricity generating capacity in the United States. As of January 2019, U.S. generating capacity at NGCC power plants totaled 264 gigawatts (GW), compared with 243 GW at coal-fired power plants.
Total capacity for generating power in the United States across all types of natural gas-fired generating technologies surpassed coal as the primary capacity resource more than 15 years ago. However, different natural gas-fired generating technologies are used differently.
Steam turbines (which can also be powered by oil or coal) combust fuel to generate steam, which is used in a steam turbine to generate electricity. Combined-cycle units heat up fuel and use the fuel-air mixture to spin gas turbines and generate electricity. The waste heat from the gas turbine is used to generate steam for a steam turbine that generates additional electricity.
Natural gas-fired combustion and steam turbines are less efficient and more expensive to run, so they are typically used only during periods of peak electricity demand. Similarly, almost all coal plants (except integrated gasification units, which are rare) combust coal to generate steam, with little opportunity for efficiency improvements.
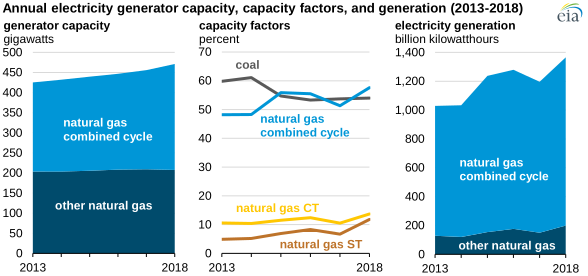
Note: CT is combustion turbine, ST is steam turbine.
As of the end of 2018, NGCC power plants accounted for about half of all U.S. natural gas-fired generating capacity, but they provided almost 90% of total natural gas-fired generation. Capacity factors for NGCC plants, which reflect their actual output as a percentage of their capacity, are nearly equivalent to those of coal plants and are typically in the 50% to 60% range, while natural gas combustion and steam turbines are much lower at about 10%.
Since the beginning of 2015, about 40 GW of coal-fired capacity have retired, and no new coal capacity has come online in the United States. During that same time period, NGCC net capacity has grown by about 30 GW. The electricity generation from these NGCC capacity additions, as well as output from new wind and solar generators, has largely offset the lost generation from coal retirements.
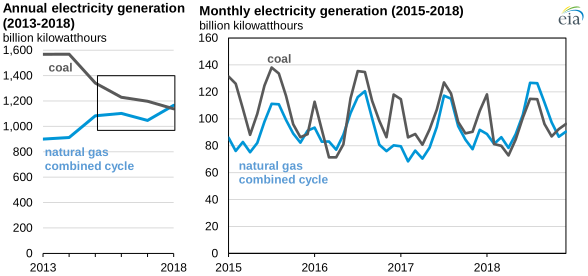
In terms of electricity generation, NGCC plants have recently begun providing more electricity than coal plants. Electricity generation from NGCC power plants first surpassed coal-fired generation on a monthly basis in December 2015 and again in the first half of 2016, during times of relatively low natural gas prices. Higher natural gas prices reversed the crossover until February 2018, when NGCC generation again surpassed coal generation. As more NGCC plants continue to come online and coal plants continue to retire, NGCC-powered electricity generation should consistently rank as the most prevalent source of electricity generation in the United States for the foreseeable future, based on projections in EIA’s most recent Annual Energy Outlook.
Principal contributor: Kenneth Dubin
Tags: generation, coal, electricity, natural gas, capacity