Thanksgiving week: EIA data highlight how energy is used in the kitchen
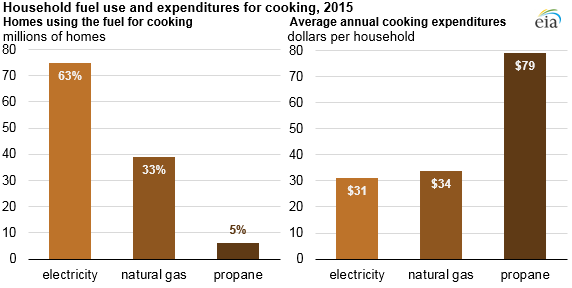
Note: Households may use more than one fuel for cooking.
As Thanksgiving nears, households across the nation are firing up their stoves, cooktops, and ovens to prepare their feasts. According to the latest data from EIA’s Residential Energy Consumption Survey (RECS), electricity is the most common fuel used for cooking, with 74.9 million households (63%) using electricity in a stove, cooktop, or oven. The cooking fuel a household uses is often the same fuel it uses to heat the home: 59% of households reported using the same type of fuel for cooking as for main space heating.
The fuel used in a household affects the cost of preparing Thanksgiving dinner and cooking throughout the year. Although electricity has the highest cost of the three fuels ($37.55 per million British thermal units), average household cooking expenditures for electricity were the lowest of the three fuels at $31 per year. Average cooking expenditures for natural gas were slightly higher at $34 per year.
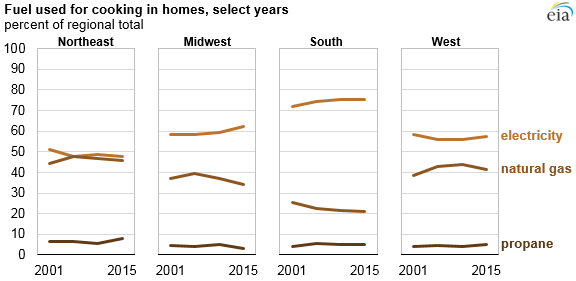
Electricity was the most common cooking fuel across all regions in 2015, but it was especially prevalent in the South, where 75% of households reported having a cooking appliance that uses electricity. Natural gas was most often used in the Northeast and West, where 46% and 41% of households used natural gas, respectively.
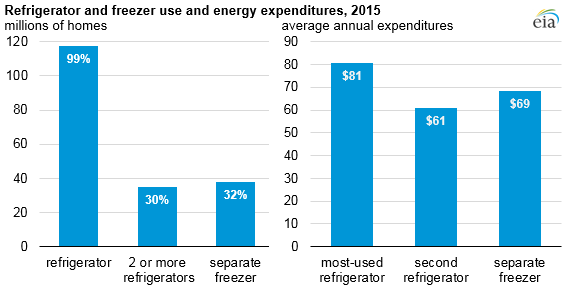
Storing food uses energy as well, and leftovers from Thanksgiving dinner can be stored in a variety of ways. Nearly all homes (99%) have a refrigerator, and nearly 30% of homes have two or more. Second refrigerators and separate freezers are most common in the Midwest, where 34% of homes have a second refrigerator. The most-used refrigerator in a home costs $81 per year to operate on average, while the second refrigerator has an average annual operating cost of $61. Second refrigerators are often smaller than the home’s most-used refrigerator, and they may not be in use the entire year—17% of homes with a second refrigerator reported that it was in use six months or less in 2015.
In 2015, 32% of households reported having a separate freezer. These appliances cost $69 per year to operate on average. Separate freezers are also most common in the Midwest, where 39% of homes have a separate freezer.
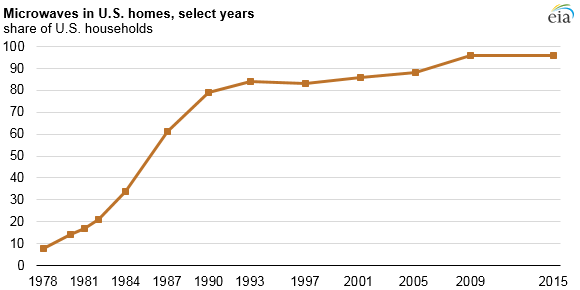
After the big meal, heating up Thanksgiving leftovers in the microwave is an option in almost all households. In 2015, 96% of households reported having a microwave oven, and 99% of those households use their microwave ovens at least once a week. On average, households with a microwave spent $17 per year on electricity to operate their devices.
The 2015 RECS introduced estimates for energy consumption and expenditures for a variety of end uses, including those discussed here. The RECS also collects information about the presence of other energy-consuming kitchen appliances in homes, such as coffee makers, toasters, and grills. More information is available in the RECS tables as well as in a microdata file.
Principal contributors: Maggie Woodward, Bill McNary