
Natural gas pipeline rupture in Canada affects U.S. energy markets
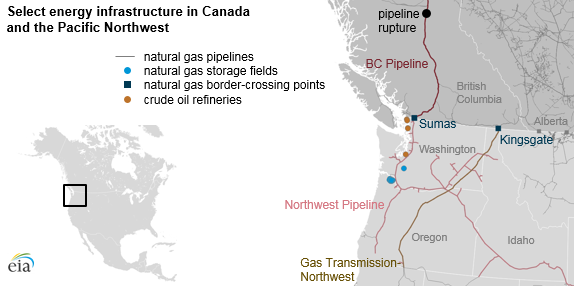
Note: Canadian pipeline map layer is copyright IHS Markit 2018 (all rights reserved).
The October 9, 2018 rupture of Enbridge’s BC natural gas pipeline near Prince George, British Columbia, continues to affect natural gas supply, electricity generation, and petroleum refining in the U.S. Pacific Northwest. The BC Pipeline links natural gas production in northeastern British Columbia with distribution markets in Canada as well as Washington, Oregon, and Idaho. Imports of natural gas through the pipeline, which in the first half of the year averaged 1.1 billion cubic feet per day (Bcf/d) at the Sumas hub import point, fell to zero for a day after the rupture.
The rupture occurred on the 36-inch diameter mainline, one of two pipelines that make up the BC Pipeline system. Both pipelines were shut down and depressurized following the rupture. On October 10, Enbridge restarted the second, smaller 30-inch diameter pipeline, which is now operating at 80% capacity. Operators were also able to transport natural gas from production areas in eastern British Columbia and Alberta through the Kingsgate import point to replace some of the disrupted supply. As of the morning of October 15, Enbridge had started constructing a temporary access road to the site of the rupture, but it has announced no timeline on when it will complete the repair work.
The pipeline rupture forced some refineries in Washington to cut production, as the pipeline carries natural gas used to operate refining units. Royal Dutch Shell and Phillips 66 both shut down refineries in the region, resulting in an increase in wholesale gasoline prices in the Pacific Northwest.
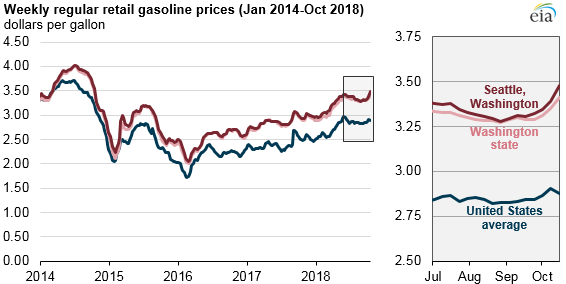
Retail gasoline prices in the area were already rising because of recent increases in crude oil prices. On October 15, the Monday following the pipeline rupture, the retail price of gasoline in Seattle rose 9 cents per gallon from the previous week’s value, the largest weekly increase since mid-2015. Also on that day, Seattle’s regular retail gasoline price was $3.48 per gallon, or about 60 cents per gallon more than the U.S. average, based on EIA’s weekly Gasoline and Diesel Fuel Update.
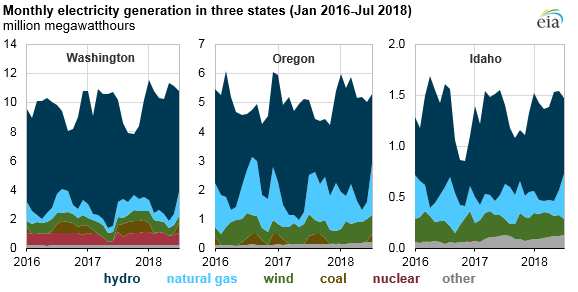
Hydroelectricity is the primary source of electricity in Washington, Oregon, and Idaho, but in each state natural gas is the second-highest source of electricity. In the days following the pipeline rupture, regional utilities, such as Puget Sound Energy, asked customers to limit natural gas and electricity use. Following the restart of the second pipeline, customers in the region were able to resume normal usage.
Natural gas storage withdrawals may offer an alternate source of natural gas until flows are fully restored on the BC Pipeline. The United States has two underground natural gas storage fields in the Pacific Northwest with a combined working gas capacity of about 41 Bcf: the Mist facility in southwestern Washington and the Jackson Prairie facility in northwestern Oregon. Overall natural gas stocks in the Pacific region (Washington, Oregon, and California) totaled 262 Bcf as of October 5, or 23% lower than the previous five-year average value for that time of year, according to EIA’s Weekly Natural Gas Storage Report.
Other changes—such as increasing electricity generation from hydroelectric facilities or other non-natural gas sources, reducing electricity exports to California from the Pacific Northwest, and decreasing natural gas deliveries to generators outside the affected area—may be implemented to manage short-term energy balances in the region.
Principal contributors: Michael Mobilia, Owen Comstock
Tags: natural gas, pipelines, Canada, map