
U.S. retail gasoline prices heading into Labor Day weekend are highest in four years
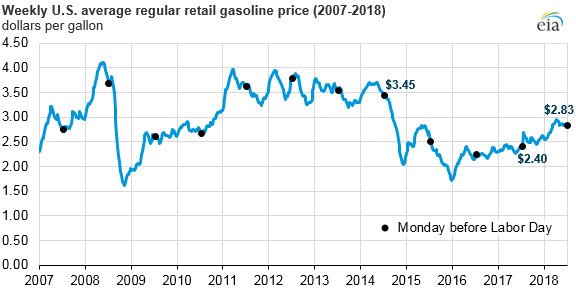
The U.S. average retail price for regular gasoline on August 27, 2018, was $2.83 per gallon (gal), the highest price on the Monday before Labor Day since 2014, when it was $3.45/gal. The 2018 price is 43 cents/gal higher than the same time last year. A higher North Sea Brent crude oil price—$18 per barrel (b) higher than the price heading into Labor Day weekend last year and its highest level for this time of year since 2014—is the main driver of the increase in the gasoline price.
Crude oil is the main input cost in the production of gasoline, and movements in the crude oil price—along with changes in gasoline market conditions—drive changes in wholesale and retail gasoline prices. EIA estimates that about two-thirds of the price of gasoline at the pump is attributable to the refinery acquisition cost of crude oil.
Because a barrel of crude oil contains 42 gallons, each dollar per barrel of sustained price change in crude oil and gasoline wholesale margins translates to an average 2.4-cent-per-gallon change in petroleum product prices. When the price of crude oil increases, the price of wholesale gasoline adjusts to reflect the increased refinery input cost, other market factors being equal.
The current higher crude oil price environment has coincided with a period of strong motor gasoline demand, which also puts upward pressure on prices. U.S. Federal Highway Administration data indicate that the cumulative miles driven in the United States through the first half of 2018 increased by 5.2 billion miles (0.3%) from the same period in 2017.
Gasoline product supplied—a proxy EIA uses for consumption—in the first five months of 2018 averaged 9.2 million barrels per day, an increase of 0.2% compared with the same period last year. Although the year-over-year rate of increase was greater in the lower price environment of 2015 and 2016, U.S. gasoline consumption measured this way reached a record high in 2017, and recent consumption remains high compared with levels in previous years at this time.
Retail gasoline prices vary significantly within the United States as a result of regional supply and demand balances, gasoline specification requirements, and taxes. The U.S. Gulf Coast—Petroleum Administration for Defense District (PADD) 3—typically has the lowest retail gasoline prices in the country because it has approximately half of U.S. refining capacity and produces more gasoline than it consumes. Through August 27, average Gulf Coast gasoline prices were 26 cents/gal lower than the national average, while West Coast (PADD 5) prices were 48 cents/gal higher.
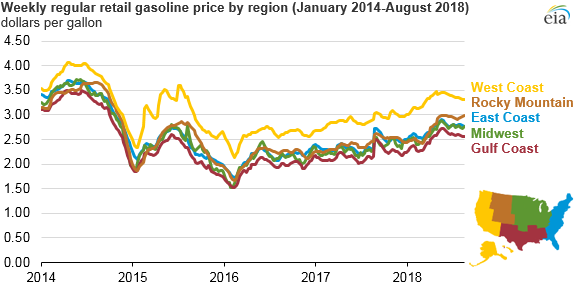
West Coast retail gasoline prices are often higher than the average U.S. price because of the region’s tight supply and demand balance, isolation from additional supply sources, and gasoline specifications that are more costly to manufacture. Since January 8, 2018, weekly West Coast regional gasoline prices have consistently exceeded $3.00/gal. Although state-level gasoline taxes and fees in California and Washington each are nearly 50 cents/gal, state-level gasoline taxes and fees across PADD 5 average 29 cents/gal, which is less than a cent higher than the national average.
U.S. regular gasoline prices averaged $2.85/gal from April through August. Gasoline prices are often higher in summer months when gasoline demand is higher and when federal and state environmental regulations require the use of summer-grade gasoline, which is more expensive to manufacture. EIA expects that the monthly average price of U.S. regular gasoline in 2018 peaked in May at $2.90/gal and anticipates prices to remain relatively flat in the fourth quarter of this year.
Principal contributor: Kelsey Hallahan
Tags: prices, gasoline, liquid fuels