
Natural gas inventories end heating season at the lowest level since 2014
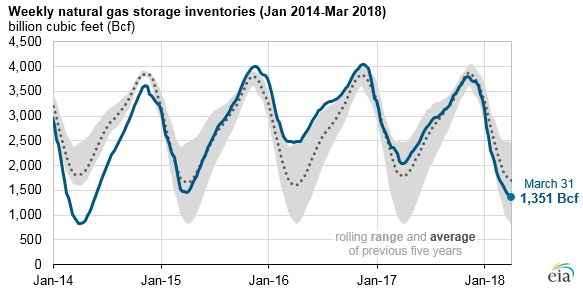
Note: Data for March 31, 2018, is an interpolated value, based on the Weekly Natural Gas Storage Report.
Working natural gas in storage in the United States as of March 31, 2018, the end of the 2017–2018 heating season, totaled 1,351 billion cubic feet (Bcf), according to EIA’s estimate based on its Weekly Natural Gas Storage Report. This is the lowest level for U.S. working gas stocks at this time of year since March 31, 2014, when working gas stocks were much lower, at 837 Bcf following the 2013-2014 heating season. As of March 31, 2018, working gas stocks were 21% lower than the previous five-year (2013–2017) average for the end of the heating season.
The 2017–2018 heating season, which began on November 1, 2017, was characterized by periods of colder-than-normal temperatures that resulted in substantial withdrawals of natural gas from storage, including an all-time weekly record-breaking withdrawal of 359 Bcf in January. Natural gas is used during colder months not only for heating homes and businesses directly, but also for fueling natural gas power plants, which are increasingly used to meet winter electricity demand.
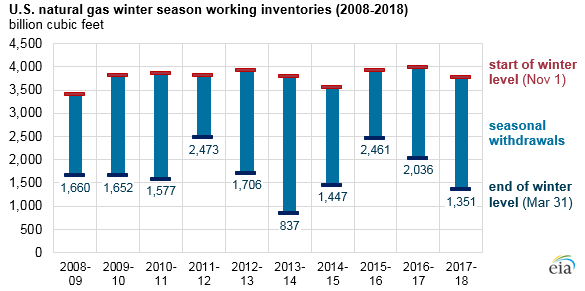
As a result of the colder-than-normal winter, net withdrawals from storage during the 2017–2018 heating season totaled 2,427 Bcf, the second-highest withdrawals on record behind only the 2,958 Bcf net withdrawals reported for the much colder-than-normal 2013–2014 winter.
This summer, EIA expects injections into storage to be higher than normal, exceeding the average of the previous five injection seasons (April through October). Because of the regulatory obligations of many of the larger storage operators to provide winter heating service, U.S. natural gas storage levels tend to end the injection season close to the previous five-year average of about 3,800 Bcf. Doing so would require injections to total nearly 2,500 Bcf, or about 30% more natural gas than the average of the previous five injection seasons.
EIA’s latest Short-Term Energy Outlook forecasts that working gas levels will total 3,767 Bcf at the end of October 2018, requiring net injections of about 2,416 Bcf over the injection season, the equivalent of 11.3 Bcf per day (Bcf/d).
Net injections of this magnitude are made possible by increases in U.S. natural gas production. EIA forecasts that dry natural gas production will average 81.6 Bcf/d during the 2018 refill season—an increase of 8.3 Bcf/d, or 11% over last year’s rate—which more than offsets forecasted increases in natural gas consumption, exports, and storage refilling requirements.
Principal contributor: Jose Villar
Tags: inventories/stocks, natural gas