
Seasonal swings in U.S. distillate inventories lower as consumption patterns change
Changes in demand trends have significantly reduced the patterns of seasonality in U.S. distillate markets. Historically, distillate use in the United States was highly seasonal because of its use as a home heating fuel. However, over the past three decades, its use as a heating fuel has decreased, distallate fuel exports have increased, and its non-seasonal use as a transportation fuel has become the major demand component.
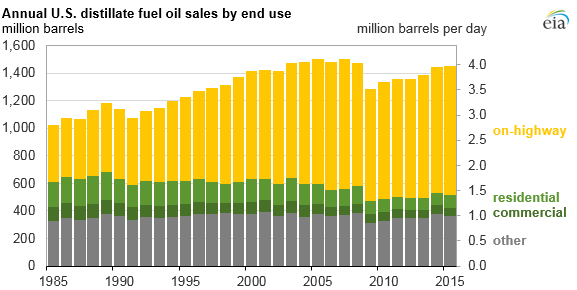
Distillate fuel is primarily used for on-highway transportation in both light- and heavy-duty vehicles. Distillate fuel is also used as a heating fuel in homes and businesses; as a fuel for certain industrial processes, agriculture, and farming; and, to a lesser extent, as a fuel for electricity generation.
U.S. consumption of distillate increased from 2.9 million barrels per day (b/d) in 1985 to 4.0 million b/d in 2015. During this period, the proportion of distillate used by homes and businesses for heating declined from 28% in 1985 to 11% in 2015 (the most recent year with sales data to end-use customers). Meanwhile, the share of on-highway distillate use increased from 40% to 64% from 1985 to 2015.
This trend is even more prominent on the East Coast, the region with the highest concentration of residential and commercial heating oil use. The East Coast share of residential and commercial distillate use dropped from 50% in 1985 to 27% in 2015, compared with the share of on-highway transportation, which increased from 32% to 58%.
Because transportation consumption of distillate fuel oil is much less seasonal than consumption of distillate fuel oil in homes and businesses, the overall seasonality in domestic demand for distillate fuel oil has significantly decreased.
Another change to U.S. distillate markets is the limits placed on sulfur in distillate fuels. Over time, the regulations limiting the amount of sulfur present in heating oil and on-highway diesel fuels have converged. Between 2006 and 2010, federal (EPA) and state regulations transitioned on-highway diesel fuel to the ultra-low sulfur diesel (ULSD) specification. Starting in 2012, several states in the Northeast gradually lowered the amount of sulfur allowed in heating oil to ultra-low sulfur diesel.
This trend culminated in the NYMEX heating oil futures contract changing to the ULSD specification in 2013. These changes created a common distillate product that can supply both home heating demand as well as transportation demand and does not require separate storage and handling facilities for the different fuels.
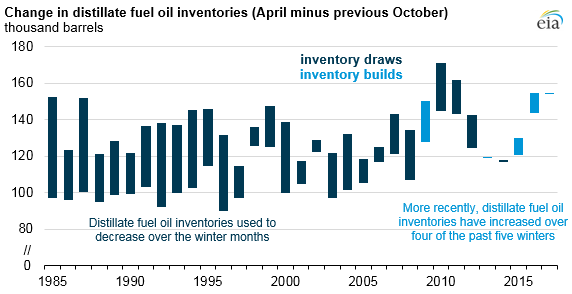
In the past, distillate inventories typically would reach their highest annual levels in the late fall or early winter and then would be drawn down during the winter months. This seasonal pattern was apparent in U.S. distillate inventories between the 1945–1946 and the 2007–2008 winter seasons. The winter of 2008–2009 marked the first time on record that distillate inventories increased over the October-to-March period. More recently, the older seasonal pattern in distillate inventories has nearly disappeared, and distillate inventories in March were higher than the previous October for three of the past five heating seasons.
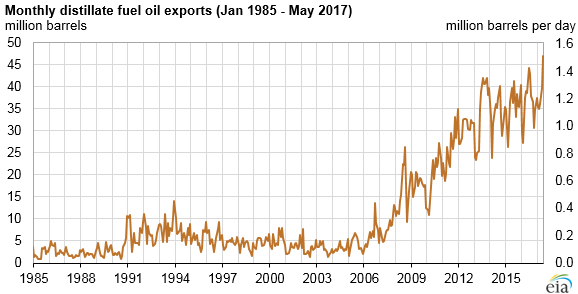
U.S. distillate exports grew to 1.2 million b/d in 2016 and set a new monthly record of 1.5 million b/d in May 2017. Recently, U.S. distillate exports have become more seasonal, offsetting the earlier seasonal trends. From 2009 through 2012, distillate exports from April through September were, on average, 116,000 b/d more than those during October through March. Since 2013, however, the seasonal difference has increased to 161,000 b/d.
Principal contributor: Mason Hamilton