
Crude oil and natural gas production in Texas and Oklahoma's Anadarko Region is growing
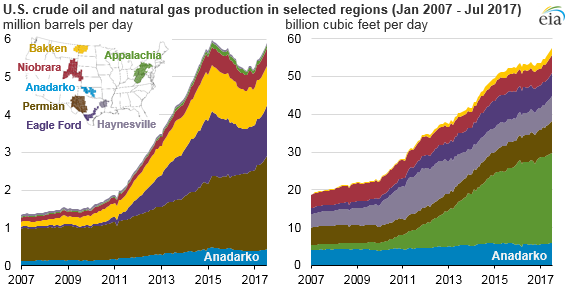
The Anadarko Region, which was recently added to EIA’s Drilling Productivity Report (DPR), accounted for 437,000 barrels per day (b/d) of oil production and 4.9 billion cubic feet per day (Bcf/d) of natural gas production in July 2017. Production in the region has increased in 2017, and the region accounted for 13% of all new wells drilled in the country in July 2017. With the inclusion of the Anadarko Region, the DPR now covers about 87% of all active onshore rigs in the United States.
The Anadarko Region covers a large portion of western Oklahoma and the northeast corner of the Texas panhandle. The region has recently seen an increase in activity, mainly from two areas commonly known as the STACK (Sooner Trend Anadarko Canadian and Kingfisher) and the SCOOP (South Central Oklahoma Oil Province) plays. The new region was defined in the DPR by identifying the most prolific oil-producing counties in the area. In 2010, the U.S. Geological Survey completed an assessment of the entire Anadarko Basin and estimated mean technically recoverable undiscovered resources of 495 million barrels of oil, 27.5 trillion cubic feet of natural gas, and 410 million barrels of natural gas liquids.
The new-well production per rig in the Anadarko Region as reported in the DPR was 372 barrels per day (b/d) in July 2017, lower than in other oil-producing DPR regions. For example, production per rig in the Permian and Bakken were 609 b/d and 1,166 b/d, respectively. However, EIA expects productivity in the Anadarko Region to continue to increase in the near future as operators complete more wells.
Drilling activity in the region has been increasing over the past year, as the rig count in the DPR region has increased from 84 in January to 129 in July. Anadarko's rate of increase is second only to that in the Permian Region in 2017.
The maturity of the oil industry in the region and its proximity to the trading and distribution hub in Cushing, Oklahoma, should allow producers to increase output using existing takeaway capacity. The relatively low transportation costs from the wellhead to Cushing may provide higher profits, allowing producers to continue operating in a relatively low-price environment. Trade press also indicates that several planned and recently completed pipelines are expanding transportation (takeaway) capacity in the region.
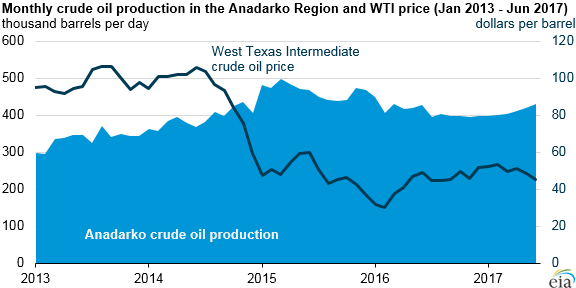
According to EIA’s DPR, oil production increased in the Anadarko Region by 112,000 b/d from July 2013 to July 2017, hitting a peak of 498,000 b/d in March of 2015. The Anadarko Region is expected to contribute to U.S. production growth, given anticipated market conditions over the next 16 months. EIA forecasts production in the Anadarko Region to grow to 500,000 b/d by the end of 2018. The West Texas Intermediate crude oil spot price is forecast to increase from $47 per barrel (b) to $53/b over the same period.
Principal contributors: Matt French, Jeffrey Barron
Tags: crude oil, liquid fuels, natural gas, Oklahoma, production/supply, states