EIA adds small-scale solar photovoltaic forecasts to its monthly Short-Term Energy Outlook
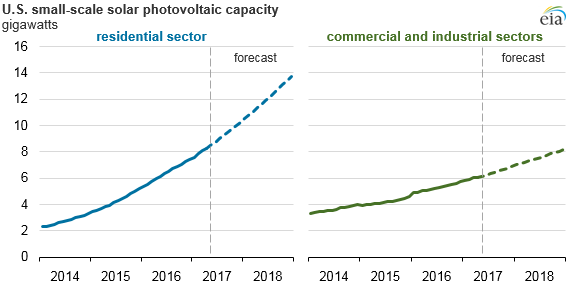
For the first time, EIA's Short-Term Energy Outlook (STEO), to be released later today, includes forecasts for small-scale solar photovoltaic (PV) capacity and electricity generation. EIA forecasts that total U.S. small-scale solar PV capacity will grow from 14.3 gigawatts (GW) at the end of April 2017 to 21.9 GW at the end of 2018. The forecast 2018 capacity includes 13.7 GW in the residential sector and 8.2 GW in the commercial and industrial sectors. Annual U.S. small-scale solar PV electricity generation is expected to grow from 19,467 gigawatthours (GWh) in 2016 to 25,400 GWh this year and 32,900 GWh in 2018.
EIA categorizes PV systems that have a generating capacity of less than one megawatt (MW), which are typically installed on business or residential rooftops, as small-scale systems. Small-scale solar photovoltaic (PV) data are based on reported alternating current (AC) capacity and may differ from other capacity estimates that use direct current (DC) ratings of PV panels. Solar PV systems in the residential sector accounted for more than half of U.S. small-scale solar capacity in 2016, even though individual residential PV systems are typically relatively small. The commercial sector, which generally has larger PV systems than the residential sector, accounted for 36% of total small-scale solar capacity last year. The industrial sector accounted for 8% of total small-scale capacity.
Residential small-scale solar PV capacity has increased significantly in recent years, reaching 7.4 GW in 2016, a 43% increase from 2015. Small-scale PV capacity in the commercial and industrial sectors has also grown, albeit at slower rates; the combined capacity in those two sectors increased 26% last year, reaching nearly 5.8 GW.
EIA’s STEO provides national-level forecasts of small-scale solar PV capacity and generation. At the state level, California is by far the leading state for small-scale PV systems, with 41% of the nation’s total small-scale PV capacity in 2016. New Jersey, Massachusetts, and Arizona round out the top four states with the largest amount of installed solar capacity and together represent 24% of the nation’s total small-scale solar PV capacity.
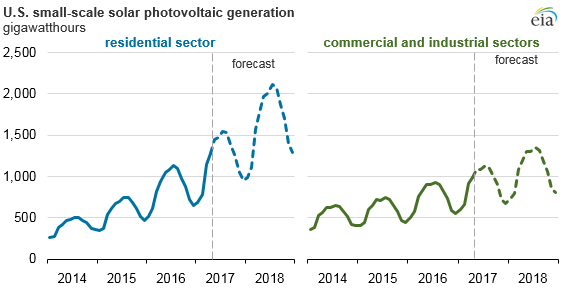
In addition to the capacity projections, STEO provides forecasts for the amount of electricity generation from small-scale solar PV systems. The July STEO projects that residential small-scale solar PV systems in the United States will generate 14,530 GWh in 2017, which is 40% higher than in 2016. Electricity generation from commercial and industrial small-scale solar PV systems is expected to grow by 22% in 2017, totaling 10,850 GWh. Solar PV output is highest in the summer months and lowest in the winter months, following the seasonal patterns in the number of hours of sunlight each day.
Despite growth in the number of small-scale solar PV systems in recent years, generation from large-scale solar power plants—those that have nameplate capacity of more than one MW—currently provides most of the solar electricity generated in the United States. EIA expects large-scale solar generation in the U.S. electric power sector in 2017 will total 50,800 GWh, which is about twice as much electricity as produced by all small-scale solar systems in the country.
Principal contributors: Tyler Hodge, Manussawee Sukunta