Wholesale electricity price changes diverge across regions during first-half of 2011
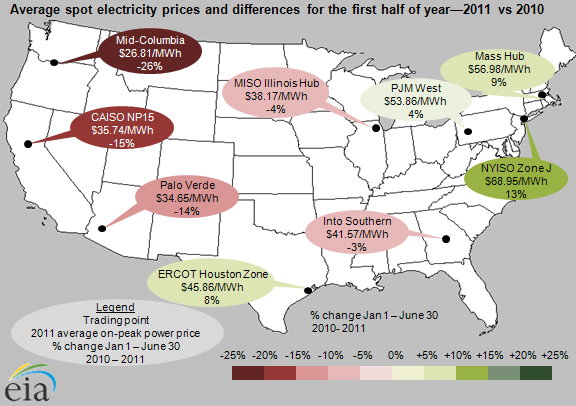
Trends in average on-peak spot electricity prices, the wholesale price of electricity at major trading points, varied across the United States in the first half (January 1 to June 30) of 2011 compared to the same period in 2010. Western prices fell 14% to 26%; Midwest and Southeast prices fell by about 4%; and Texas and Northeast prices were up 4% to 13%. Key drivers of wholesale electric prices during the first half of 2011 were temperatures, natural gas prices, hydroelectric resource availability, and the disposition of nuclear power plants.
Key drivers:
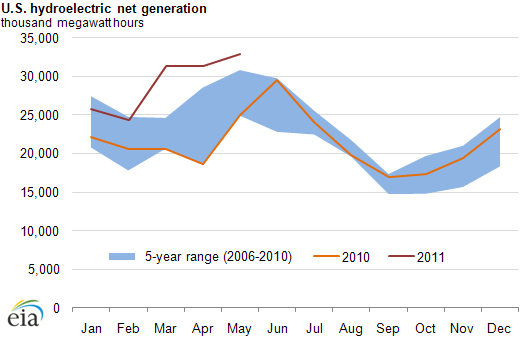
Higher western hydroelectric generation: Prices in the West were driven down by the availability of inexpensive hydroelectric generation and mild temperatures. Significant declines were seen in the Pacific Northwest and Northern California as hydroelectric output increased above five-year highs.
Download CSV Data
Mixed, spot natural gas prices: Electricity prices in New York and New England were largely driven by increasing fuels prices; natural gas prices rose in parts of the Northeast due to pipeline constraints. In the West, low natural gas prices contributed to low power prices.
Temperature anomalies: New York ISO Zone J and Massachusetts Hub prices increased as the number of heating degree days was higher from January to May of 2011 when compared to 2010. The slight decrease in prices in the South accompanied warmer January and February months in 2011 than in 2010. Texas saw several low temperature events spike wholesale markets in February.
Nuclear outages and extreme weather events: Wholesale prices in the PJM region increased slightly, although temperatures were mild throughout the winter and into June compared to the first half of 2010. Higher electricity prices in the Northeast were partly due to five-year highs in nuclear fleet outages, clustered largely in PJM's control area. Most of the nuclear outages were associated with refueling, but some outages were unplanned, caused by tornadoes and other extreme weather events damaging transmission lines.
Tags: electricity, Massachusetts, natural gas, nuclear, prices, spot prices