Electric Power Monthly
Download all tables ZIP
Executive Summary
- ES1.A Total Electric Power Industry
- ES1.B Total Electric Power Industry, Year-to-Date
- ES2.A Receipts and Cost of Fossil Fuels for the Electric Power Industry by Sector, Physical Units
- ES2.B Receipts and Cost of Fossil Fuels for the Electric Power Industry by Sector, Btus
Chapter 1. Net Generation
- by
- 1.1 Energy Source: Total - All Sectors
- 1.1.A Renewable Sources: Total - All Sectors
- 1.2.A Energy Source: Electric Utilities
- 1.2.B Energy Source: Independent Power Producers
- 1.2.C Energy Source: Commercial Sector
- 1.2.D Energy Source: Industrial Sector
- 1.2.E Energy Source: Residential Sector
- 1.3.A State by Sector
- 1.3.B State by Sector, Year-to-Date
- from
- 1.4.A Coal by State by Sector
- 1.4.B Coal by State by Sector, Year-to-Date
- 1.5.A Petroleum Liquids by State by Sector
- 1.5.B Petroleum Liquids by State by Sector, Year-to-Date
- 1.6.A Petroleum Coke by State by Sector
- 1.6.B Petroleum Coke by State by Sector, Year-to-Date
- 1.7.A Natural Gas by State by Sector
- 1.7.B Natural Gas by State by Sector, Year-to-Date
- 1.7.C Utility Scale Facility Net Generation from Natural Gas by Technology: Total (All Sectors)
- 1.8.A Other Gases by State by Sector
- 1.8.B Other Gases by State by Sector, Year-to-Date
- 1.9.A Nuclear Energy by State by Sector
- 1.9.B Nuclear Energy by State by Sector, Year-to-Date
- 1.10.A Hydroelectric (Conventional) Power by State by Sector
- 1.10B Hydroelectric (Conventional) Power by State by Sector, Year-to-Date
- 1.11.A Renewables Sources Excluding Hydroelectric by State by Sector
- 1.11.B Renewables Sources Excluding Hydroelectric by State by Sector, Year-to-Date
- 1.12.A Hydroelectric (Pumped Storage) Power by State by Sector
- 1.12.B Hydroelectric (Pumped Storage) Power by State by Sector, Year-to-Date
- 1.13.A Other Energy Sources by State by Sector
- 1.13.B Other Energy Sources by State by Sector, Year-to-Date
- 1.14.A Wind by State by Sector
- 1.14.B Wind by State by Sector, Year-to-Date
- 1.15.A Biomass by State by Sector
- 1.15.B Biomass by State by Sector, Year-to-Date
- 1.16.A Geothermal by Census Division by Sector
- 1.16.B Geothermal by Census Division by Sector, Year-to-Date
- 1.17.A Solar Photovoltaic by Census Division by Sector
- 1.17.B Solar Photovoltaic by Census Division by Sector, Year-to-Date
- 1.18.A Solar Thermal by Census Division by Sector
- 1.18.B Solar Thermal by Census Division by Sector, Year-to-Date
Chapter 2. Consumption of Fossil Fuels
- Coal: Consumption for
- 2.1.A Electricity Generation by Sector
- 2.1.B Useful Thermal Output by Sector
- 2.1.C Electricity Generation and Useful Thermal Output by Sector
- Petroleum Liquids: Consumption for
- 2.2.A Electricity Generation by Sector
- 2.2.B Useful Thermal Output by Sector
- 2.2.C Electricity Generation and Useful Thermal Output by Sector
- Petroleum Coke: Consumption for
- 2.3.A Electricity Generation by Sector
- 2.3.B Useful Thermal Output by Sector
- 2.3.C Electricity Generation and Useful Thermal Output by Sector
- Natural Gas: Consumption for
- 2.4.A Electricity Generation by Sector
- 2.4.B Useful Thermal Output by Sector
- 2.4.C Electricity Generation and Useful Thermal Output by Sector
- Landfill Gas: Consumption for
- 2.5.A Electricity Generation by Sector
- 2.5.B Useful Thermal Output by Sector
- 2.5.C Electricity Generation and Useful Thermal Output by Sector
- Biogenic Municipal Solid Waste: Consumption for
- 2.6.A Electricity Generation by Sector
- 2.6.B Useful Thermal Output by Sector
- 2.6.C Electricity Generation and Useful Thermal Output by Sector
- Wood / Wood Waste Biomass: Consumption for
- 2.7.A Electricity Generation by Sector
- 2.7.B Useful Thermal Output by Sector
- 2.7.C Electricity Generation and Useful Thermal Output by Sector
- Consumption of Coal for
- 2.8.A Electricity Generation by State by Sector
- 2.8.B Electricity Generation by State by Sector, Year-to-Date
- Consumption of Petroleum Liquids for
- 2.9.A Electricity Generation by State by Sector
- 2.9.B Electricity Generation by State by Sector, Year-to-Date
- Consumption of Petroleum Coke for
- 2.10.A Electricity Generation by State by Sector
- 2.10.B Electricity Generation by State by Sector, Year-to-Date
- Consumption of Natural Gas for
- 2.11.A Electricity Generation by State by Sector
- 2.11.B Electricity Generation by State by Sector, Year-to-Date
- Consumption of Landfill Gas for
- 2.12.A Electricity Generation by State by Sector
- 2.12.B Electricity Generation by State by Sector, Year-to-Date
- Consumption of Biogenic Municipal Solid Waste for
- 2.13.A Electricity Generation by State by Sector
- 2.13.B Electricity Generation by State by Sector, Year-to-Date
- Consumption of Wood / Wood Waste Biomass for
- 2.14.A Electricity Generation by State by Sector
- 2.14.B Electricity Generation by State by Sector, Year-to-Date
Chapter 3. Fossil-Fuel Stocks for Electricity Generation
- Stocks of Coal, Petroleum Liquids, and Petroleum Coke:
- 3.1 Electric Power Sector
- 3.2 Electric Power Sector, by State
- 3.3 Electric Power Sector, by Census Division
- 3.4 Stocks of Coal by Coal Rank
Chapter 4. Receipts and Cost of Fossil-Fuels
- Receipts, Average Cost, and Quality of Fossil Fuels:
- 4.1 Total (All Sectors)
- 4.1 Total (All Sectors) (continued)
- 4.2 Electric Utilities
- 4.2 Electric Utilities (continued)
- 4.3 Independent Power Producers
- 4.3 Independent Power Producers (continued)
- 4.4 Commercial Sector
- 4.4 Commercial Sector (continued)
- 4.5 Industrial Sector
- 4.5 Industrial Sector (continued)
- Receipts of Coal Delivered for
- 4.6.A Electricity Generation by State
- 4.6.B Generation by State, Year-to-Date
- Receipts of Petroleum Liquids Delivered for
- 4.7.A Electricity Generation by State
- 4.7.B Generation by State, Year-to-Date
- Receipts of Petroleum Coke Delivered for
- 4.8.A Electricity Generation by State
- 4.8.B Electricity Generation by State, Year-to-Date
- Receipts of Natural Gas Delivered for
- 4.9.A Electricity Generation by State
- 4.9.B Electricity Generation by State, Year-to-Date
- Average Cost of Coal Delivered for
- 4.10.A Electricity Generation by State
- 4.10.B Electricity Generation by State, Year-to-Date
- Average Cost of Petroleum Liquids Delivered for
- 4.11.A Electricity Generation by State
- 4.11.B Electricity Generation by State, Year-to-Date
- Average Cost of Petroleum Coke Delivered for
- 4.12.A Electricity Generation by State
- 4.12.B Electricity Generation by State, Year-to-Date
- Average Cost of Natural Gas Delivered for
- 4.13.A Electricity Generation by State
- 4.13.B Electricity Generation by State, Year-to-Date
- Receipts and Quality of Coal by Rank Delivered for Electricity Generation
- 4.14 Total (All Sectors) by State
- 4.15 Electric Utilities by State
- 4.16 Independent Power Producers by State
- 4.17 Commercial Combined Heat and Power Producers by State
- 4.18 Industrial Combined Heat and Power Producers by State
Chapter 5. Sales, Revenue, and Average Price of Electricity
- 5.1 Sales of Electricity to Ultimate Customers: Total by End-Use Sector
- 5.2 Revenue from Sales of Electricity to Ultimate Customers: Total by End-Use Sector
- Average Price of Electricity to Ultimate Customers:
- 5.3 Total by End-Use Sector
- Sales of Electricity to Ultimate Customers by
- 5.4.A End-Use Sector, by State
- 5.4.B End-Use Sector, by State, Year-to-Date
- Revenue from Sales of Electricity to Ultimate Customers by
- 5.5.A End-Use Sector, by State
- 5.5.B End-Use Sector, by State, Year-to-Date
- Average Price of Electricity to Ultimate Customers by
- 5.6.A End-Use Sector, by State
- 5.6.B End-Use Sector, by State, Year-to-Date
- Ultimate Customers by
- 5.7 Number of Ultimate Customers Served by Sector
- 5.8 Number of Ultimate Customers Served by Sector and State
Chapter 6. Capacity
- 6.1 Electric Generating Summer Capacity Changes
- 6.1.A Net Summer Capacity for Utility Scale Solar Photovoltaic and Small Scale Solar Photovoltaic Capacity (Megawatts)
- 6.1.B Net Summer Capacity for Estimated Small Scale Solar Photovoltaic Capacity by Sector (Megawatts)
- Net Summer Capacity:
- 6.2A Net Summer Capacity of Utility Scale Units by Technology by State
- 6.2B Net Summer Capacity Using Primarily Renewable Energy Sources by State
- 6.2C Net Summer Capacity of Utility Scale Units Using Primarily Fossil Fuels by State
- Utility Scale Generating Units
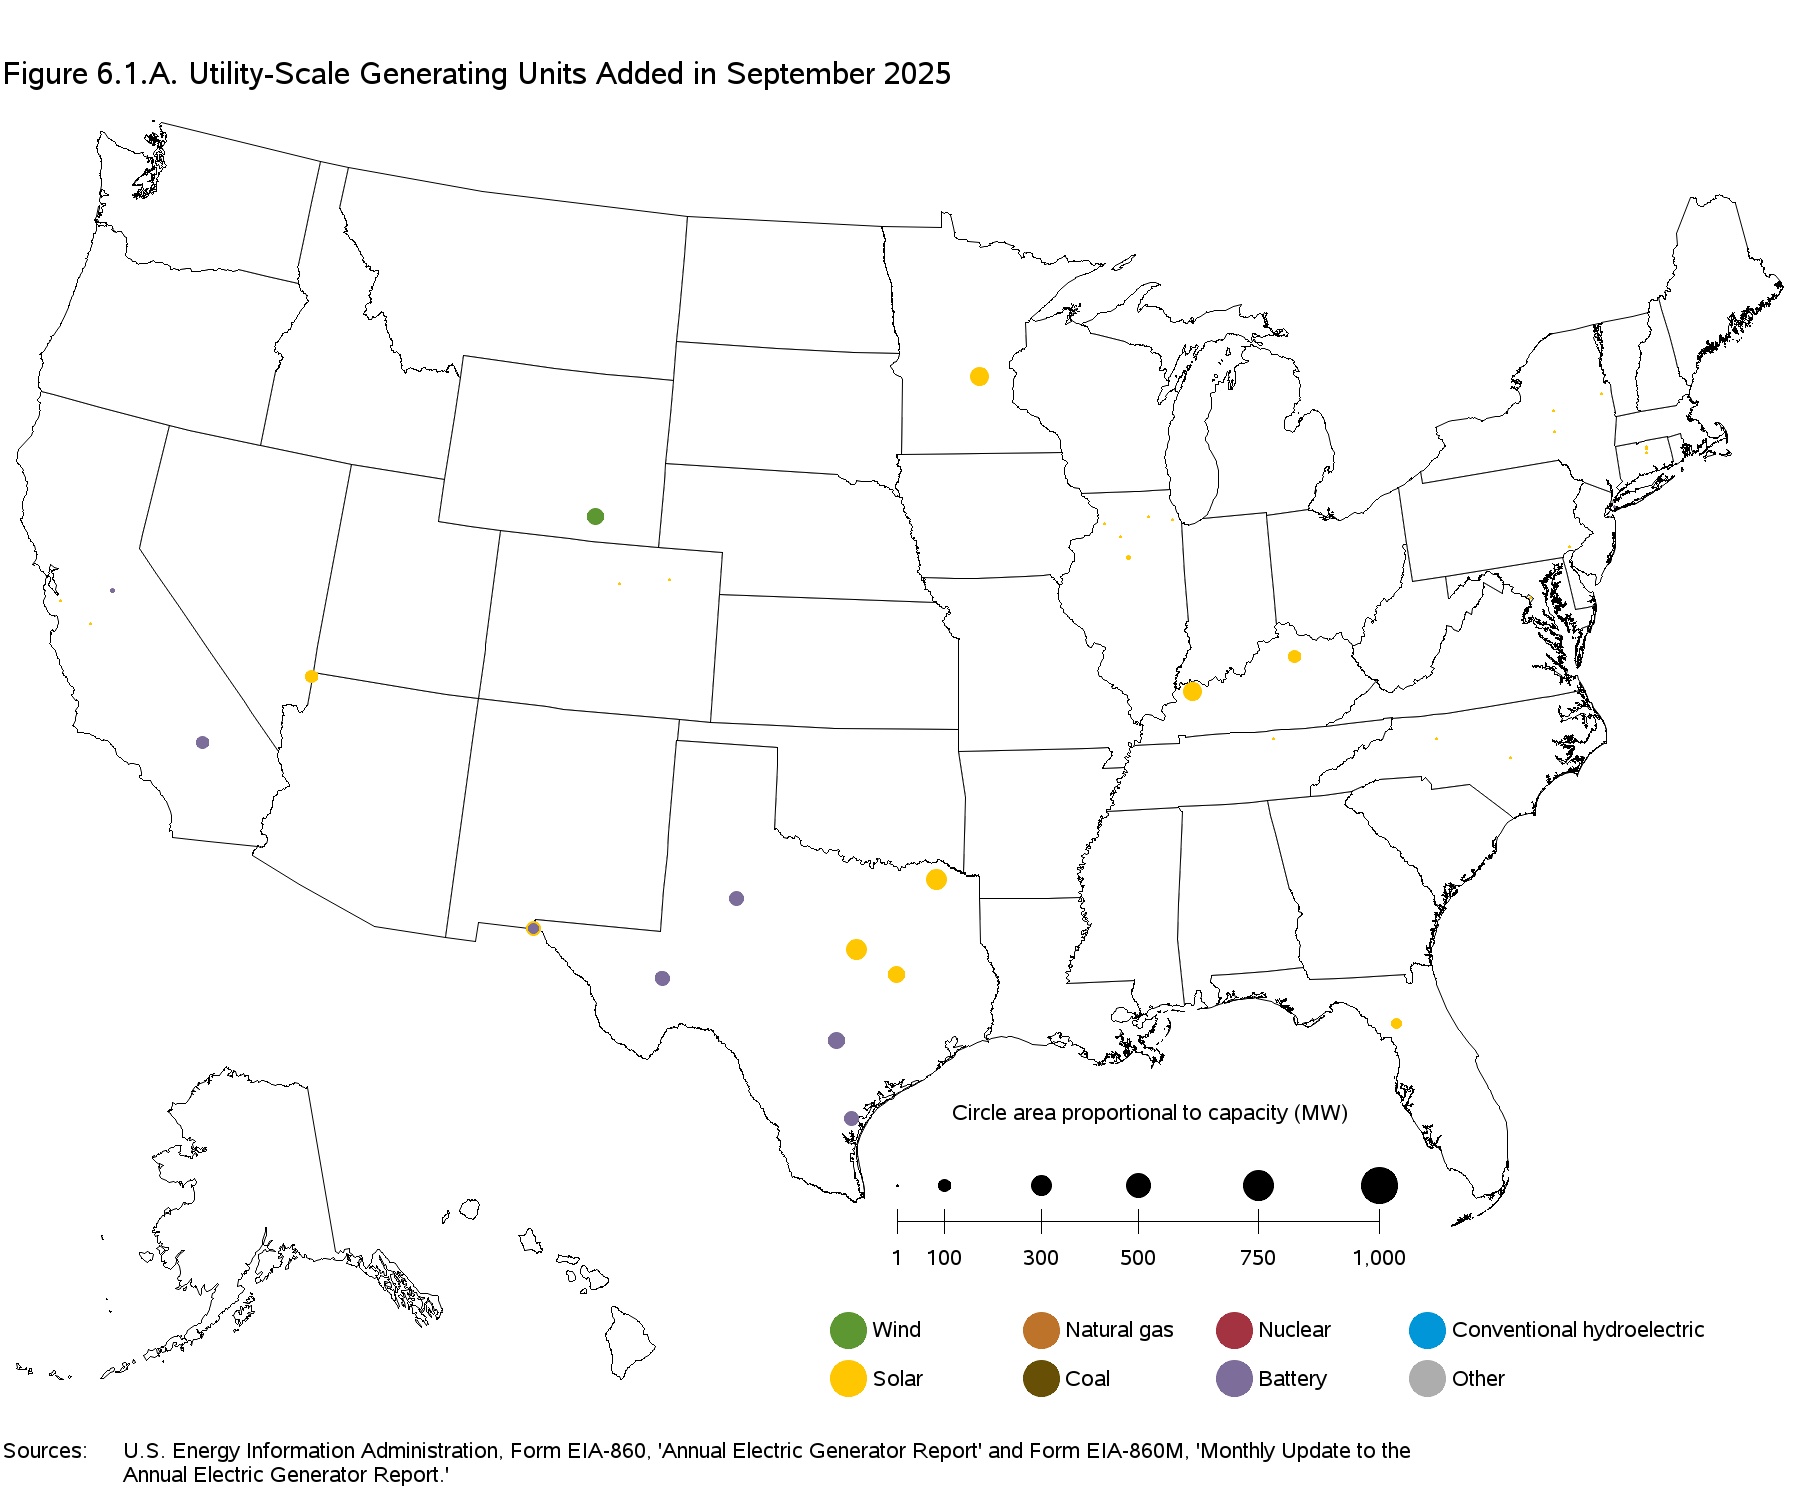
- 6.3 New Utility Scale Generating Units by Operating Company, Plant, and Month
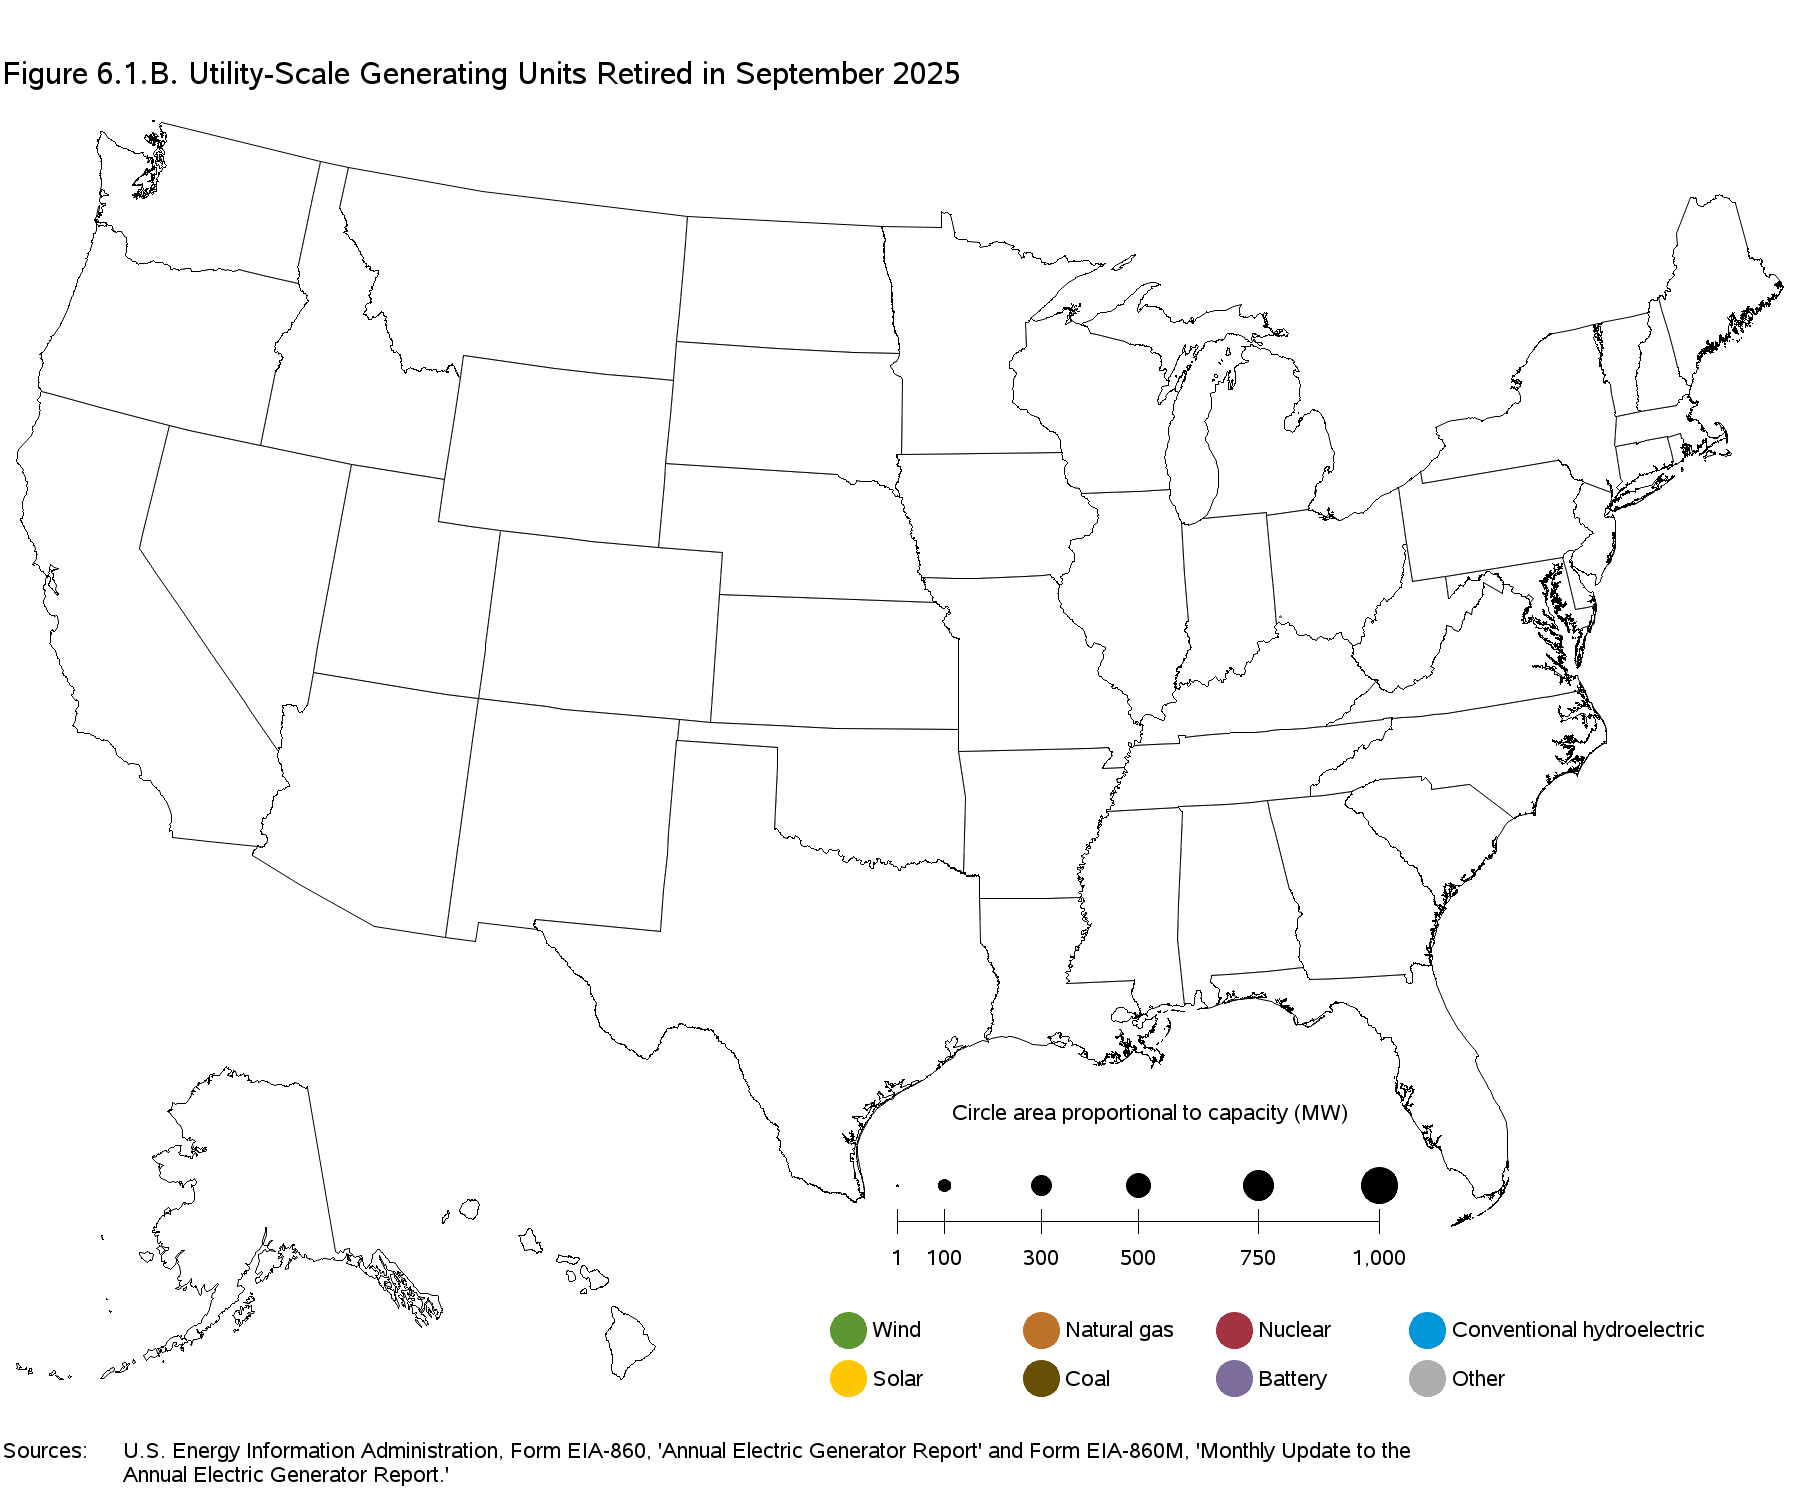
- 6.4 Retired Utility Scale Generating Units by Operating Company, Plant, and Month
- Planned
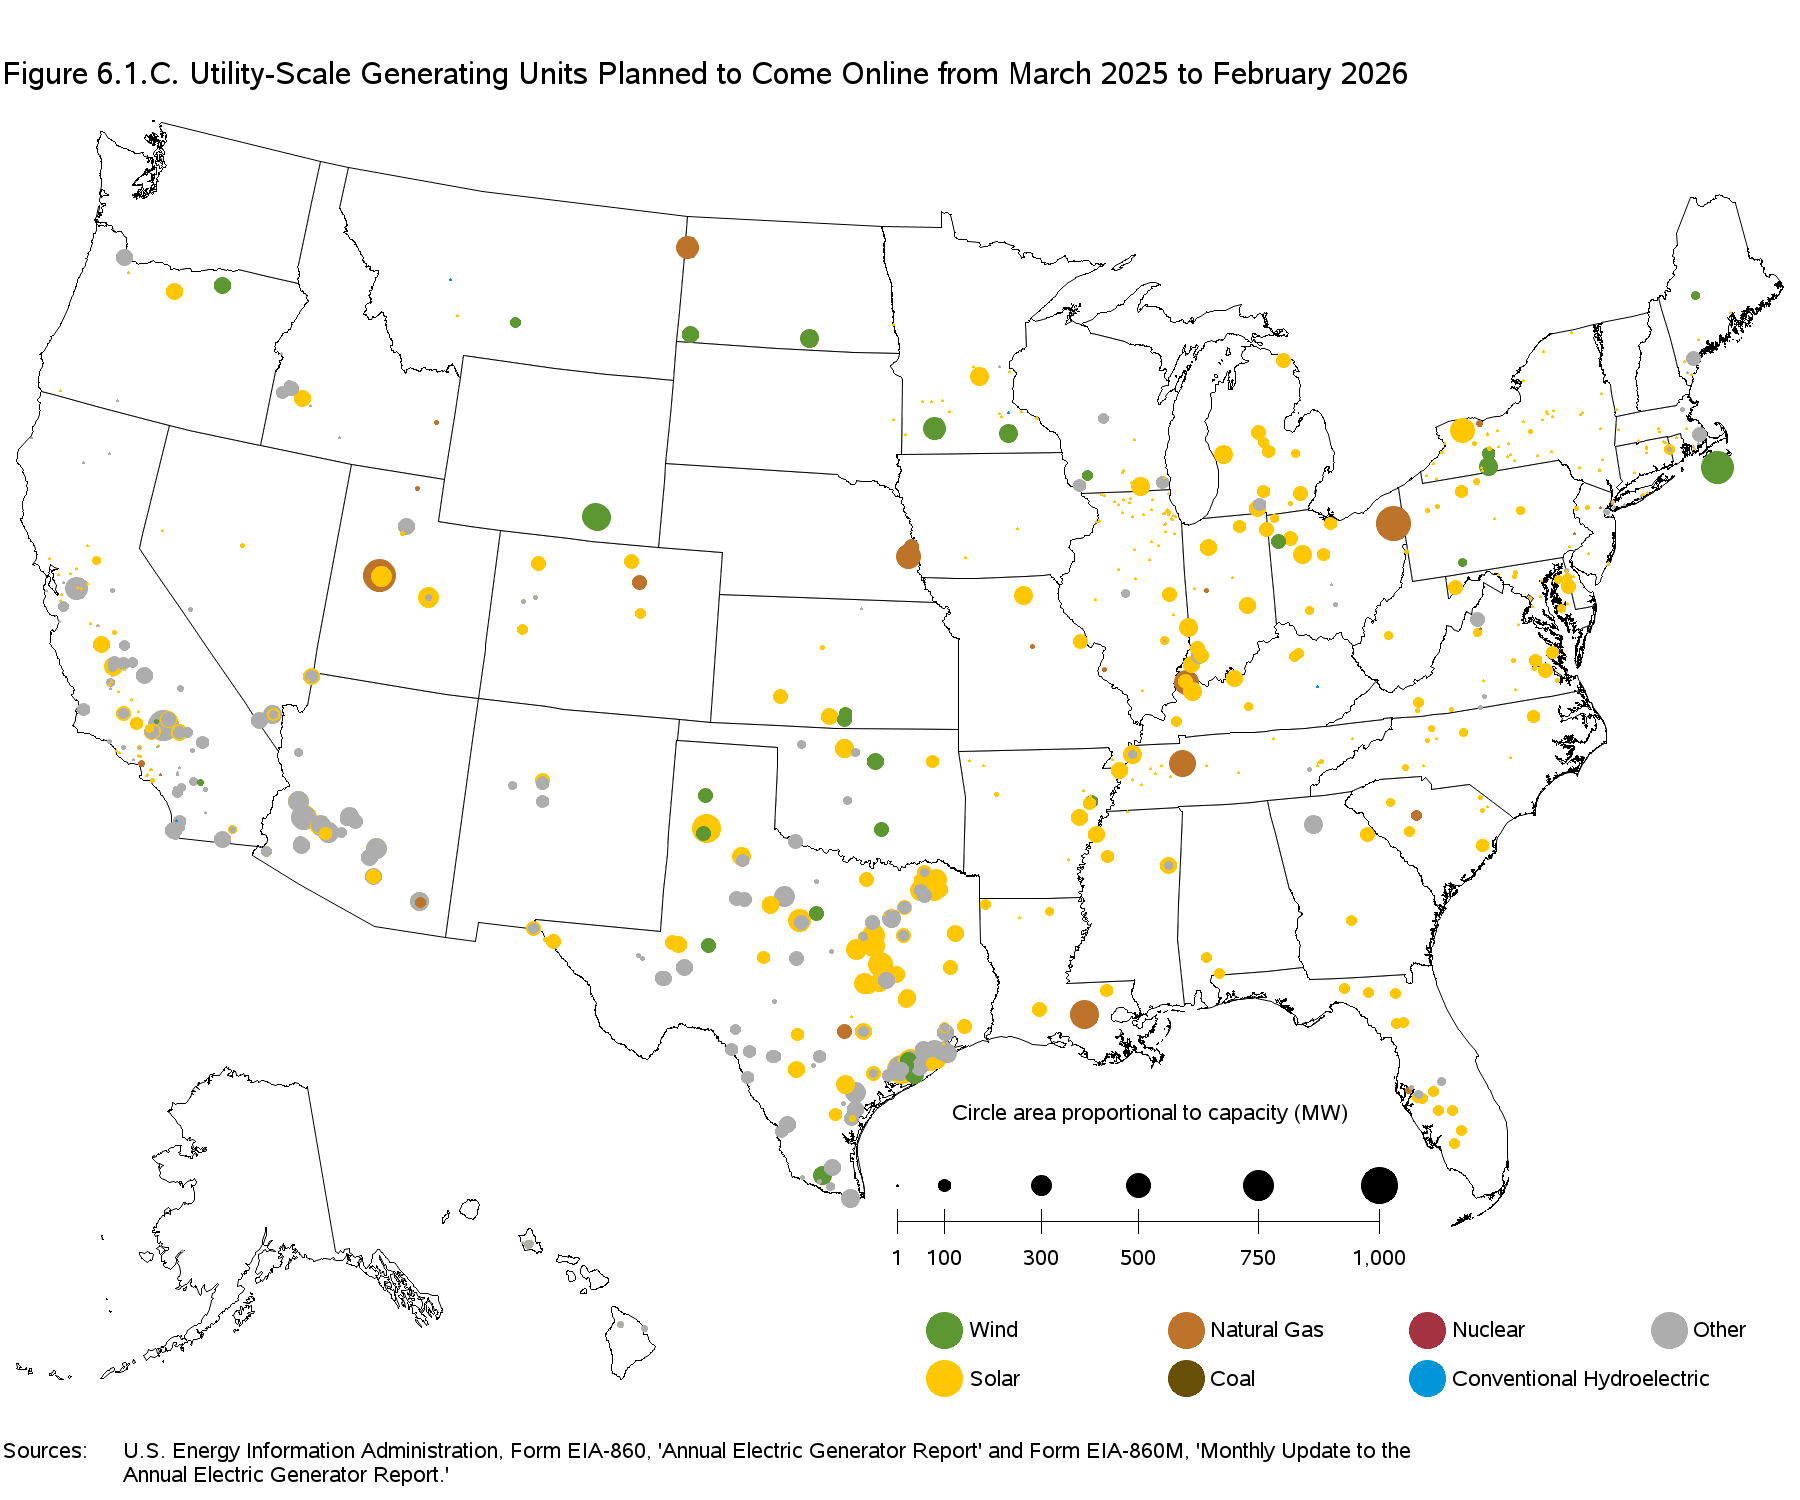
- 6.5 Planned U.S. Electric Generating Unit Additions
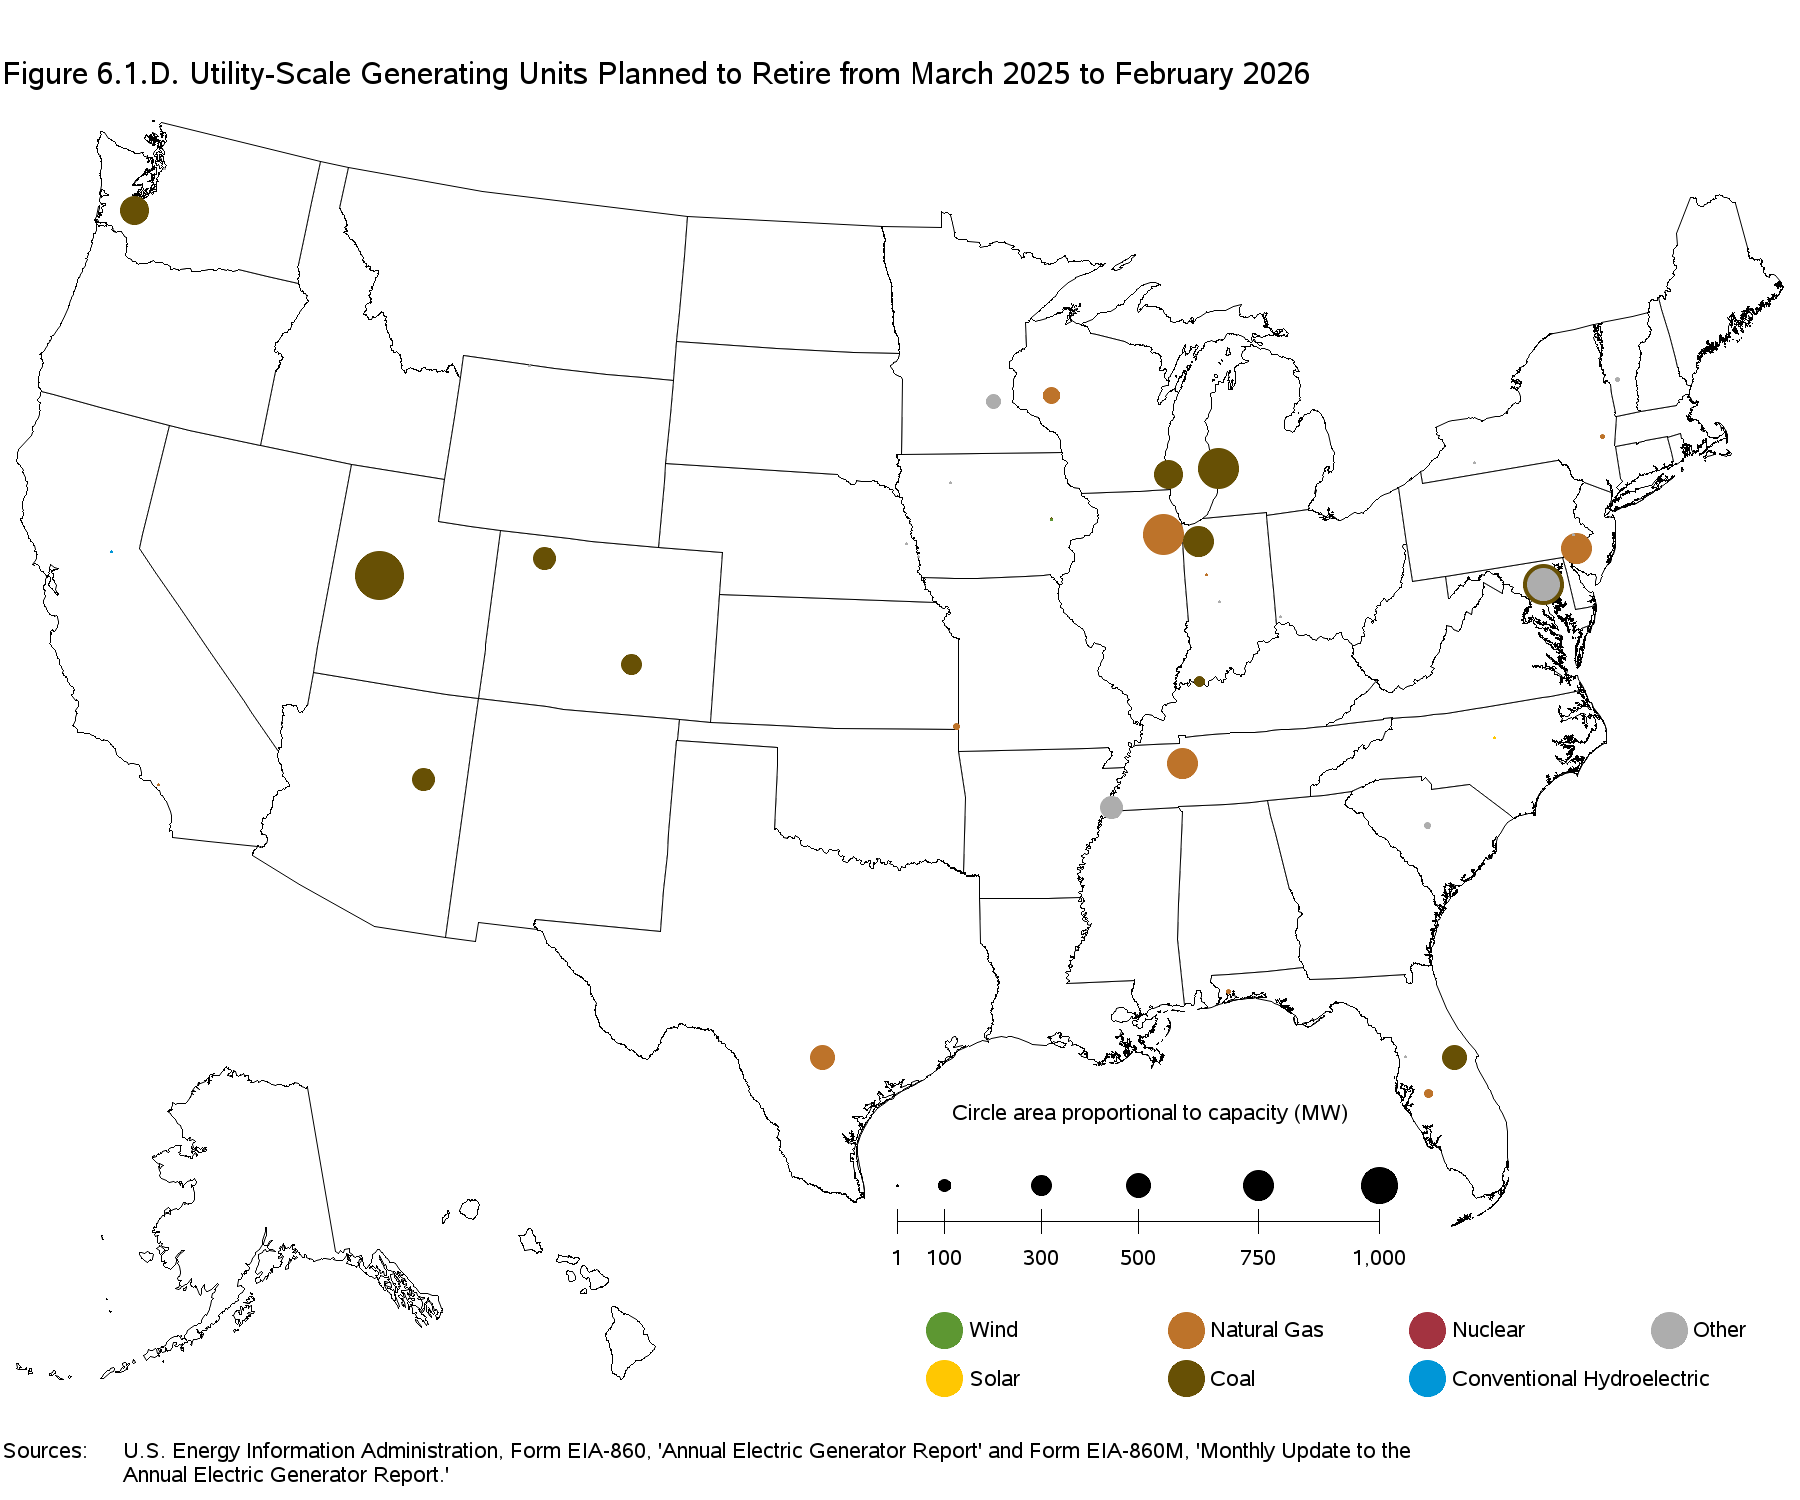
- 6.6 Planned U.S. Electric Generating Unit Retirements
- Capacity Factors
- 6.7.A Capacity Factors for Utility Scale Generators Primarily Using Fossil Fuels
- 6.7.B Capacity Factors for Utility Scale Generators Not Primarily Using Fossil Fuels
- 6.7.C Usage Factors for Utility Scale Storage
Chapter 7. Imports and Exports of Electricity
- 7.1 Electric Power Industry - U.S. Electricity Imports from and Electricity Exports to Canada and Mexico
Chapter 8. Puerto Rico
- 8.1 Puerto Rico - Sales of Electricity to Ultimate Customers: Total by End-Use Sector
- 8.2 Puerto Rico - Revenue from Sales of Electricity to Ultimate Customers: Total by End-Use Sector
- 8.3 Puerto Rico - Number of Ultimate Customers Served by Sector: Total by End-Use Sector
- 8.4 Puerto Rico - Average Price of Electricity to Ultimate Customers: Total by End-Use Sector
- 8.5 Net Summer Capacity (MW) of Existing Utility Scale Units by Technology for Puerto Rico
Appendix A. Relative Standard Error
- Relative Standard Error for Net Generation:
- A1.A Total (All Sectors) by Census Division and State
- A1.A Total (All Sectors) by Census Division and State (Continued)
- A1.B Total (All Sectors) by Census Division and State, Year-to-Date
- A1.B Total (All Sectors) by Census Division and State, Year-to-Date (Continued)
- A1.C Small Scale Solar by Sector, Census Division and State
- A2.A Electric Utilities by Census Division and State
- A2.A Electric Utilities by Census Division and State (Continued)
- A2.B Electric Utilities by Census Division and State, Year-to-Date
- A2.B Electric Utilities by Census Division and State, Year-to-Date (Continued)
- A3.A Independent Power Producers by Census Division and State
- A3.A Independent Power Producers by Census Division and State (continued)
- A3.B Independent Power Producers by Census Division and State, Year-to-Date
- A3.B Independent Power Producers by Census Division and State, Year-to-Date (continued)
- A4.A Commercial Sector by Census Division and State
- A4.A Commercial Sector by Census Division and State (continued)
- A4.B Commercial Sector by Census Division and State, Year-to-Date
- A4.B Commercial Sector by Census Division and State, Year-to-Date (continued)
- A5.A Industrial Sector by Census Division and State
- A5.A Industrial Sector by Census Division and State (continued)
- A5.B Industrial Sector by Census Division and State, Year-to-Date
- A5.B Industrial Sector by Census Division and State, Year-to-Date (continued)
- Relative Standard Error for Retail Sales of Electricity to
- A6.A Ultimate Customers by End-Use Sector, Census Division, and State
- A6.B Ultimate Customers by End-Use Sector, Census Division, and State, Year-to-Date
- Relative Standard Error for Revenue from Retail Sales of Electricity to
- A7.A Ultimate Customers by End-Use Sector, Census Division, and State
- A7.B Ultimate Customers by End-Use Sector, Census Division, and State, Year-to-Date
- Relative Standard Error for Average Retail Price of Electricity to
- A8.A Ultimate Customers by End-Use Sector, Census Division, and State
- A8.B Ultimate Customers by End-Use Sector, Census Division, and State, Year-to-Date
Appendix B.
Suspended
Appendix C. Technical Notes
- Technical notes
- C1 Average Heat Content of Fossil-Fuel Receipts
- C2 Comparison of Preliminary Monthly Data Versus Final Monthly Data at the U.S. Level, 2017 Through 2019
- C3 Comparison of Annual Monthly Estimates Versus Annual Data at the U.S. Level, All Sectors 2017 Through 2019
- C4 Unit-of-Measure Equivalents for Electricity
- Electric Power Data by Month and State, 2001 to the Present
- Net Generation by State by Type of Producer by Energy Source
- Fossil Fuel Consumption for Electricity Generation by Year, Industry Type and State
Appendix D. Estimated U.S. Electricity Consumption by Light-duty Electric Vehicles
- Estimated U.S. Electricity Consumption by Light-duty Electric Vehicles and Methodology
- D1 Estimated U.S. Consumption of Electricity by Light-Duty Electric Vehicle Types
- D2 Estimated State and Regional Consumption of Electricity by Light-Duty Electric Vehicles, Monthly, Year-to-Date
- D3 Estimated State and Regional Consumption of Electricity by Light-Duty Electric Vehicles, Annual
- Questions/comments: Electricity data experts
Latest Electricity Trends
- The Electricity Monthly Update features a major event or an informative topic in the electric power industry and highlights key indicators at a glance.
Maps
Generating unit additions
Generating unit retirements